Raj's dashboard, updated this morning, shows Stratus dynasty with diversified XFG.3 family at plurality, accounting for quarter of all samples. Notably, GISAID submissions don't reflect CDC's estimated growth of XFZ & XFV recombinants.
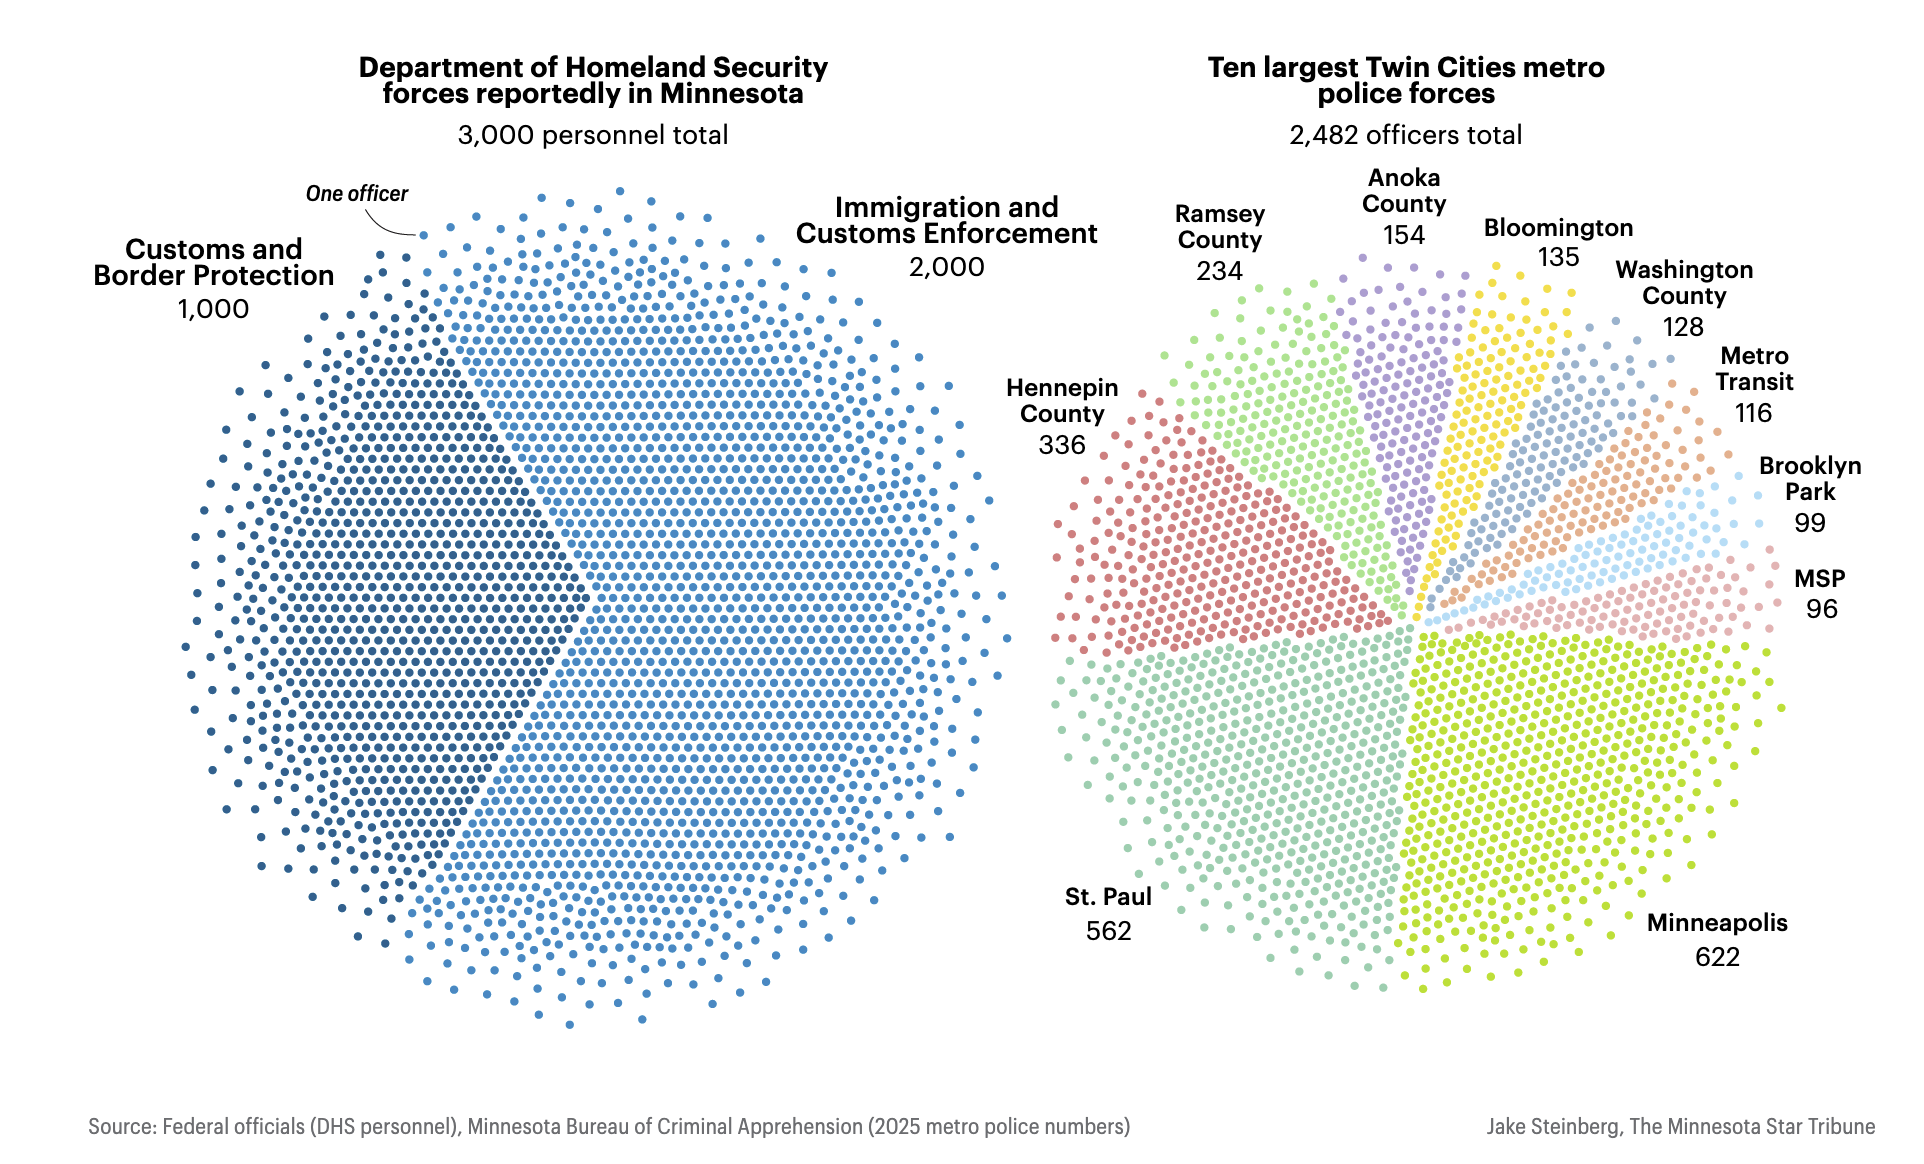
GISAID data for the most recent four-week period is dominated by paltry submissions from New York (80 sequences), followed by Maryland (45), Colorado (41), Minnesota (33), and Illinois (26).
After missing last month's update for reason of government shutdown, #CDC's most recent dataset, updated Friday, finally breaks out estimates for multiple XFG subvariants.
Nowcast suggests three XFG strains have gained significant share in past four weeks, along with two recombinants, XFZ (child of PG.3.2 and XFC.3) and XFV (child of LP.8.1 and XFG.3.3.1).
Note that, in absence of robust data from states, CDC has given up modeling historical estimates, instead giving only shares of reported sequences.
❖ #ThisIsOurPolio #variants #CovidIsNotOver #dataviz #datavis


![Chart: Est. & Reported U.S. Variant Proportions by Common Name
Sources: CDC, Cov-Lineages, NYITCOM, D. Focosi, WHN, others
[ beadsland on Ko-fi ]
Reskin of CDC's Variants Nowcast, and any significant variants in GISAID not broken out by CDC.
Four bar-style tree-charts, for four-week periods through Oct 26–Nov 22. Legend of last four-week period, organized by subheadings of color-grouped families and convergent clusters. Percentages overlay each color key, reflecting share as of most recent tree-chart.
Nearly all WHO-Vaccine-Target JN.1 dynasty. Stratus XFG family accounts for over four fifths share.
For 9/28–10/25, packed bubble charts fill single-variant tiles, reflecting GISAID detail not shown by CDC's Nowcast.
Legend:
XFG [reds]:
69% - XFG.2†, XFG.3†, XFG.3.4.1 / QF†, XFG.5.1†, XFG.4.1†, XFG.5.2†, XFG.3.4.3 / QS† & other Stratus XFG
10% - XFG.14.1
8% - XFG.1 & XFG.6
JN.1.11 [browns]:
9% - XFZ, XFV, NW.1 & FDA-Vaccine-Target LP.8.1
0% - other JN.1.11
JN.1 + FLiRT-LF-7 [blues]:
⅛% - LF.7.9
¼% - other LF.7
LF.7 + NTD-meets-RBD [purples]:
⅕% - XFC
0% - other LF.7 + NTD-meets-RBD
WHO-Vaccine-Target JN.1 [green]:
0% - XEC
Other [greys]:
4% - Nimbus NB.1.8.1 / PQ, XFY & XDV.1
⅓% - Other (not specified)
_____
XFC is a child of April's WHO-Vaccine-Target scion LF.7 and Mayish JN.1.11 scion LP.8.1.1 / NY.
XFZ is a child of left-field WHO-Vaccine-Target scion PG.3.2 and Augustish recombinant kid XFC.3.
[Some footnotes omitted, due to too many recombinants.]](https://spaces.hcommons.social/media_attachments/files/115/593/558/972/069/259/original/acda4b217362c2d6.jpg)
![Chart: Estimated and Reported U.S. Variant Proportions by Common Name
Sources: CDC, Cov-Lineages, NYITCOM, D. Focosi, WHN, others
[ beadsland on Ko-fi ]
Reskin of CDC's Variants Nowcast, and any significant variants in GISAID not broken out by CDC.
Four bar-style tree-charts, for four-week periods through Oct 26–Nov 22. Legend of last four-week period, organized by subheadings of color-grouped families and convergent clusters. Percentages overlay each color key, reflecting share as of most recent tree-chart.
Nearly all WHO-Vaccine-Target JN.1 dynasty. Stratus XFG family accounts for over four fifths share.
For 10/26–11/22, packed bubble charts fill single-variant tiles, indicating diversification (per GISAID) not apparent from CDC's Nowcast.
Legend:
XFG [reds]:
69% - XFG.2†, XFG.3†, XFG.3.4.1 / QF†, XFG.4.1† & other Stratus XFG
10% - XFG.14.1
8% - XFG.6, XFG.1.1† & other XFG.1
JN.1.11 [browns]:
9% - XFZ, XFV, NW.1 & FDA-Vaccine-Target LP.8.1
0% - other JN.1.11
JN.1 + FLiRT-LF-7 [blues]:
⅛% - LF.7.9
¼% - other LF.7
LF.7 + NTD-meets-RBD [purples]:
⅕% - XFC
0% - other LF.7 + NTD-meets-RBD
WHO-Vaccine-Target JN.1 [green]:
0% - XEC
Other [greys]:
4% - Nimbus NB.1.8.1 / PQ, XFY & XDV.1
⅓% - Other (not specified)
_____
XFC is a child of April's WHO-Vaccine-Target scion LF.7 and Mayish JN.1.11 scion LP.8.1.1 / NY.
XFZ is a child of left-field WHO-Vaccine-Target scion PG.3.2 and Augustish recombinant kid XFC.3.
[Some footnotes omitted, due to too many recombinants.]](https://spaces.hcommons.social/media_attachments/files/115/604/954/797/965/200/original/9fd4ea416a51f94d.jpg)
![Chart: Estimates of Long Covid: Extrapolated to Entire U.S. Population
Data: Census Bureau, Nat'l Cntr for Health Stats, Dept of Health & Human Svcs, Bureau of Labor Stats (via FRED), CDC
[ beadsland on Ko-fi ]
Line chart, from Apr 2022 to date, of:
• Ever Experienced Long Covid for 3+ Months (61M as of Sep '24)
• Reported Staffed Hospital Beds (2.1K per Million) [Was 2.3K Apr '22]
• Population 16+ With a Disability — Labor Stats (35.1M) [Apr '22: 32.7M]
• Now Living with LC (18.1M)
• Current Activity Limitations from LC (15M)
• Significant Limitations (4.4M)
Caption (in part):
Household Pulse Survey (HPS)…an Internet questionnaire…by…Census Bureau…includes questions regarding “any symptoms lasting 3 months or longer that you did not have prior to having coronavirus or COVID-19.” [Note] that the list of long-term symptoms, provided for this question, may not reflect all sequelae of covid infection, e.g., systemic organ damage or increased susceptibility to subsequent infections and other adverse health outcomes.
NCHS uses HPS responses to estimate incidence of [LC] in adult population. With [retraction & new studies] now assume U.S. under 18 population (22% of total) meet criteria for [LC] at same rate as adults.
Census…was due to relaunch Household Pulse Survey (HPS) as Household Trends and Outlook Pulse Survey (HTOPS)…January 2025….had been no relaunch as of [Jan 20].…now is word of a general moratorium on…executive branch agencies communicating with the public…."](https://spaces.hcommons.social/media_attachments/files/115/590/745/390/060/689/original/ddcd4845190e4843.png)
![Chart: Est. & Reported U.S. Variant Proportions by Common Name
Sources: CDC, Cov-Lineages, NYITCOM, others
[ beadsland on Ko-fi ]
Reskin of CDC's Variants Nowcast, and any significant variants in GISAID not broken out by CDC.
Four bar-style tree-charts, for four-week periods through 8/31–9/27. Legend of last four-week period, organized by subheadings of color-grouped families and convergent clusters. Percentages overlay each color key, reflecting share as of most recent tree-chart.
Mostly WHO-Vaccine-Target JN.1 dynasty. Stratus XFG family accounts for largely share.
For 8/31–9/27, packed bubble charts fill single-variant tiles, reflecting GISAID detail not shown by CDC's Nowcast.
Legend:
LF.7 + NTD-meets-RBD [red]:
85% - XFG.2†, XFG.3†, XFG.4.1†, XFG.3.4.1 / QF†, XFG.5.1†, XFG.14.1†, XFG.5.2†, XFG.8†, XFG.3.15† & other Stratus XFG
JN.1.11 [browns]:
0% - KP.3
0% - KP.1.1.3 / LP, PA.1 & MC.10.1
6% - NW.1 & other FDA-Vaccine-Target LP.8.1
JN.1 + FLiRT-LF-7 [blues]:
⅖% - LF.7.9, LF.7.7.1 / PV & LF.7.2.1 / PC
⅗% - other LF.7
LF.7 + NTD-meets-RBD [purple]:
⅗% - XFC
JN.1 [greens]:
¼% - JN.1.16.1 / LF
0% - XEC & XEC.4
Other [greys]:
7% - Nimbus NB.1.8.1 / PQ, XDV.1 & other Omicron-2 BA.2
⅒% - Omicron B.1.1.529 / BA & Other (not specified)
_____
Omicron-2 BA.2 is a child of 2022 Omicron B.1.1.529.
Stratus XFG is a child of April's WHO-Vaccine-Target scion LF.7 and Juneish JN.1.11 scion LP.8.1.2 / NW.
[Some footnotes omitted, due to too many recombinants.]](https://spaces.hcommons.social/media_attachments/files/115/341/879/876/683/538/original/a913de87b5db0e87.jpg)
![Chart: Estimated and Reported U.S. Variant Proportions by Common Name
Sources: CDC, Cov-Lineages, NYITCOM, D. Focosi, WHN, others
[ beadsland on Ko-fi ]
Reskin of CDC's Variants Nowcast, and any significant variants in GISAID not broken out by CDC.
Four bar-style tree-charts, for four-week periods through Aug 31–Sep 27. Legend of last four-week period, organized by subheadings of color-grouped families and convergent clusters. Percentages overlay each color key, reflecting share as of most recent tree-chart.
Mostly WHO-Vaccine-Target JN.1 dynasty. Stratus XFG family accounts for largely share.
For 8/3–8/30, packed bubble charts fill single-variant tiles, indicating diversification (per GISAID) not apparent from CDC's Nowcast.
Legend:
LF.7 + NTD-meets-RBD [red]:
85% - XFG.3†, XFG.2† & other Stratus XFG
JN.1.11 [browns]:
0% - KP.3
0% - KP.1.1.3 / LP, PA.1 & MC.10.1
6% - NW.1 & other FDA-Vaccine-Target LP.8.1
JN.1 + FLiRT-LF-7 [blues]:
⅖% - LF.7.9, LF.7.7.1 / PV & LF.7.2.1 / PC
⅗% - other LF.7
LF.7 + NTD-meets-RBD [purples]:
⅗% - XFC
0% - other LF.7 + NTD-meets-RBD
JN.1 [greens]:
¼% - JN.1.16.1 / LF
0% - XEC & XEC.4
Other [greys]:
7% - Nimbus NB.1.8.1 / PQ, PQ.2†, XDV.1 & other Omicron-2 BA.2
⅒% - Omicron B.1.1.529 / BA & Other (not specified)
_____
Omicron-2 BA.2 is a child of 2022 Omicron B.1.1.529.
Stratus XFG is a child of April's WHO-Vaccine-Target scion LF.7 and Juneish JN.1.11 scion LP.8.1.2 / NW.
[Some footnotes omitted, due to too many recombinants.]](https://spaces.hcommons.social/media_attachments/files/115/295/547/437/473/101/original/d7a4f6be45095a38.jpg)
![Chart: Annoplot Dataviz Library*: Project Profile
Subtitle: 12.3K lines† across component modules and significant submodules.
Multi-level pie chart organized into six major categories by color. Each outer wedge shows a tally of number of lines for that sub-component.
Green variants devpie/slice wedge notably exploded out, main devpie & variants wedges slightly; grey dot wedge also exploded somewhat.
A legend is split across both sides of the chart. Each key mirrors one of the wedges on the dual pie chart, along with a sentence or two description of each (sub)component thereby represented.
Caption:
* Pre-release development version 2025-09-30.
† Python, Markdown, C, Elixir, and shell source files. Blank lines omitted form tallies.
Exploded wedges reflect proportions of lines changed in prior 31 days. Dotted areas represent non-blank comment lines and Markdown.
Wedges:
🔴 levels
🧀 [blank wedge] - 460, 🧀 hospitals - 282
🟣 chirp
🧀 [blank] - 537
🔵 annoplot
🧀 [blank] - 544, 🧀 artists - 419, 🧀 artists/adorn - 360, 🧀 artists/deco - 511, 🧀 artists/legend - 419, 🧀 artists/text - 331, 🧀 coord - 583, 🧀 coord/base - 259, 🧀 margin - 256, 🧀 util - 537
🟢 tiop
🧀 [blank] - 235, 🧀 bullseye - 321, 🧀 capacity - 455, 🧀 devpie - 570, 🧀 devpie/slice - 295, 🧀 variants - 754, 🧀 variants/legend - 389, 🧀 variants/orchard - 432, 🧀 variants/rajdash - 600, 🧀 variants/tree - 437, 🧀 …/tree/branch - 359
🟤 bots
🧀 [blank] - 181, 🧀 talky - 821
⚫ . [period by itself]
🧀 [blank] - 458, 🧀 TODO.md - 497](https://spaces.hcommons.social/media_attachments/files/115/295/439/246/247/805/original/4118e39017420e08.jpg)
![Chart: Est. & Reported U.S. Variant Proportions by Common Name
Sources: CDC, Cov-Lineages, NYITCOM, others
[ beadsland on Ko-fi ]
Reskin of CDC's Variants Nowcast, and any significant variants in GISAID not broken out by CDC.
Four bar-style tree-charts, for four-week periods through 8/3–8/30. Legend of last four-week period, organized by subheadings of color-grouped families and convergent clusters. Percentages overlay each color key, reflecting share as of most recent tree-chart.
Stratus XFG family accounts for over three quarters share.
For 8/3–8/30, packed bubble charts fill single-variant tiles, reflecting GISAID detail not shown by CDC's Nowcast.
Legend:
LF.7 + NTD-meets-RBD [red]:
78% - XFG.3†, XFG.2† & other Stratus XFG
Omicron-2 BA.2 [brown]:
14% - XDV.1, PQ.2† & other Nimbus NB.1.8.1 / PQ
JN.1 [greens]:
5% - FDA-Vaccine-Target LP.8.1, NW.1, PA.1 & MC.28.1
⅕% - XEC
0% - KP.3, XEK & other WHO-Vaccine-Target JN.1
JN.1 + FLiRT-LF-7 [blues]:
⅖% - LF.7.9 & LF.7.2.1 / PC
1% - other LF.7
LF.7 + NTD-meets-RBD [purples]:
½% - XFC
0% - other LF.7 + NTD-meets-RBD
Other [greys]:
0% - other Omicron-2 BA.2
⅒% - Other (not specified)
_____
Omicron-2 BA.2 is a child of 2022 Omicron B.1.1.529.
Stratus XFG is a child of April's WHO-Vaccine-Target scion LF.7 and Juneish WHO-Vaccine-Target scion LP.8.1.2 / NW.
WHO-Vaccine-Target JN.1 is a grandchild of Winter 2023–24's Pirola BA.2.86.
[Some footnotes omitted, due to too many recombinants.]](https://spaces.hcommons.social/media_attachments/files/115/178/228/659/278/296/original/114b67a7475872ed.jpg)
