A doughnut chart showing different types of theft. A caption says all data is for the US, and all amounts are per year. The chart is credited to @CivicAction.

One section of the doughnut, roughly one quarter of it, is separated from the main part and labeled "other types of theft", while the main section is labeled "wage theft" in large letters.

The "other types" section is broken down as follows:

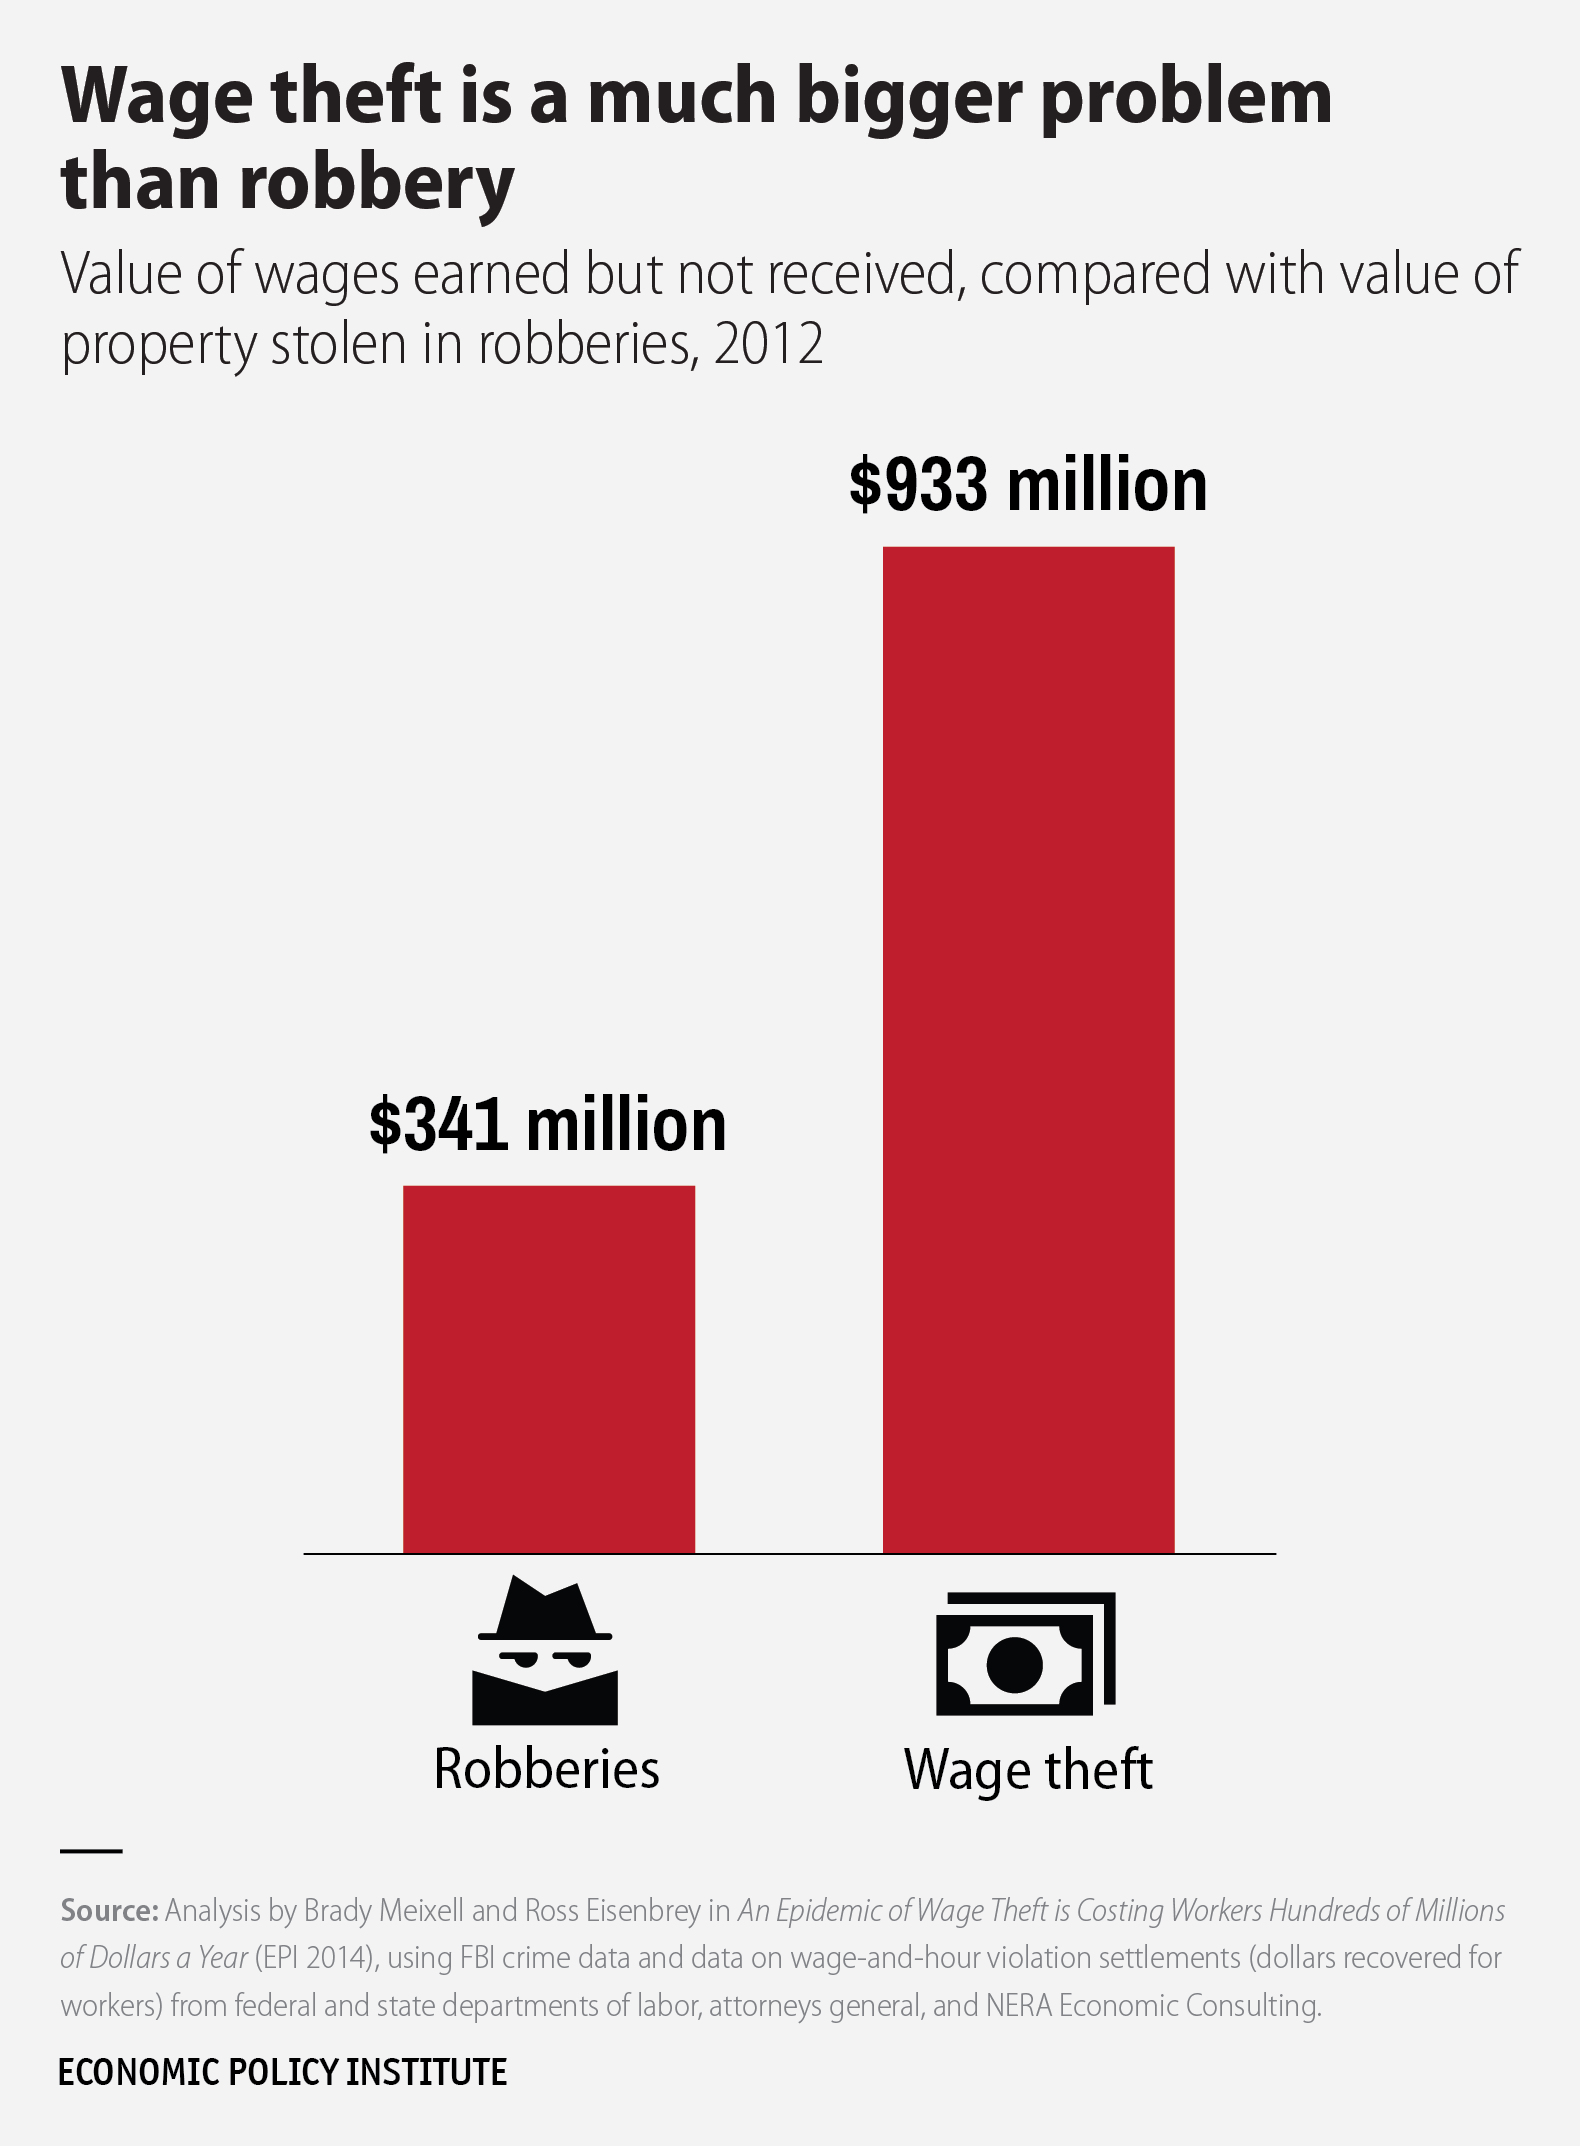
Robbery, $0.34 billion, which equals 0.64% of the full total.
Auto theft, $3.80 billion, 7.2% of total.
Burglary, $4.1 billion, 7.77%.
And larceny, $5.3 billion and 10.04 percent.

The "Other Types" section totals to 25.67% of the entire doughnut.

Wage theft is broken down as follows:

Off-the-clock violations, $3.2 billion, 6.06%.
Rest break violations, $4 billion exactly, 7.58%.
Overtime violations, $8.8 billion, 16.68%.
Minimum wage violations, $23.2 billion, making 43.99 percent of the total.

Wage theft totals 74.32% of the entire doughnut.
A doughnut chart showing different types of theft. A caption says all data is for the US, and all amounts are per year. The chart is credited to @CivicAction. One section of the doughnut, roughly one quarter of it, is separated from the main part and labeled "other types of theft", while the main section is labeled "wage theft" in large letters. The "other types" section is broken down as follows: Robbery, $0.34 billion, which equals 0.64% of the full total. Auto theft, $3.80 billion, 7.2% of total. Burglary, $4.1 billion, 7.77%. And larceny, $5.3 billion and 10.04 percent. The "Other Types" section totals to 25.67% of the entire doughnut. Wage theft is broken down as follows: Off-the-clock violations, $3.2 billion, 6.06%. Rest break violations, $4 billion exactly, 7.58%. Overtime violations, $8.8 billion, 16.68%. Minimum wage violations, $23.2 billion, making 43.99 percent of the total. Wage theft totals 74.32% of the entire doughnut.