Ah, must be summer. Lots of lizards in the backyard missing their tails, which is typical when the striped racer snakes have emerged. #snek #summer #climatediary
A remarkable article about a *real* conspiracy —
«Oil companies purchased solar and electric vehicle patents to ensure others couldn’t use them, solicited control of renewable markets and then abandoned them, and funded powerful institutions to promote false solutions, all while using trade groups to downplay the harms of fossil fuels, according to the complaint.
The alleged conspiracy began after 1979…»
#ClimateDiary #FossilFuels #Conspiracy #OilAndGas
https://www.levernews.com/how-a-secret-oil-cartel-might-have-killed-our-clean-energy-future/?utm_source=newsletter-email&utm_medium=link&utm_campaign=newsletter-article
So so good.
Andrew Percy* of the Institute of Global Prosperity (IGP) on
Universal Basic Services (UBS*) and “living in the flow”
Borrowed a car today and so was traffic for the first time in quite a while. (To assist with house cleaning/clearance.)
Can confirm that I and several thousand others are in denial of fossil-fuelled overshoot
…The thing about ‘overshoot’ as a term is that it implies that we can fit right back in to how things were before we shat 2 trillion tonnes of GHGs into the air, but that’s not how planetary systems work.
So yeah, in denial 🙋♂️
Borrowed a car today and so was traffic for the first time in quite a while. (To assist with house cleaning/clearance.)
Can confirm that I and several thousand others are in denial of fossil-fuelled overshoot
Brilliant episode.
Do yourself a favour and get a half-hour heads up on the shape of where we are going
When climate breakdown meets Nobel economics:
“Bake a brittle Nordhaus world, asshole.”
To be sung to the tune of ‘Birdhouse in Your Soul’ by They Might Be Giants.
…Not to put too fine a point on it
Tell the whole world “Don’t worry, we’re on it”
Bake a brittle Nordhaus world, asshole.
We have a secret to tell
“Electrify!” not going too well
But our simple message
Says you can have the whistles and bells
So the world should listen to we
Filibuster vigilantly…
When climate breakdown meets Nobel economics:
“Bake a brittle Nordhaus world, asshole.”
To be sung to the tune of ‘Birdhouse in Your Soul’ by They Might Be Giants.
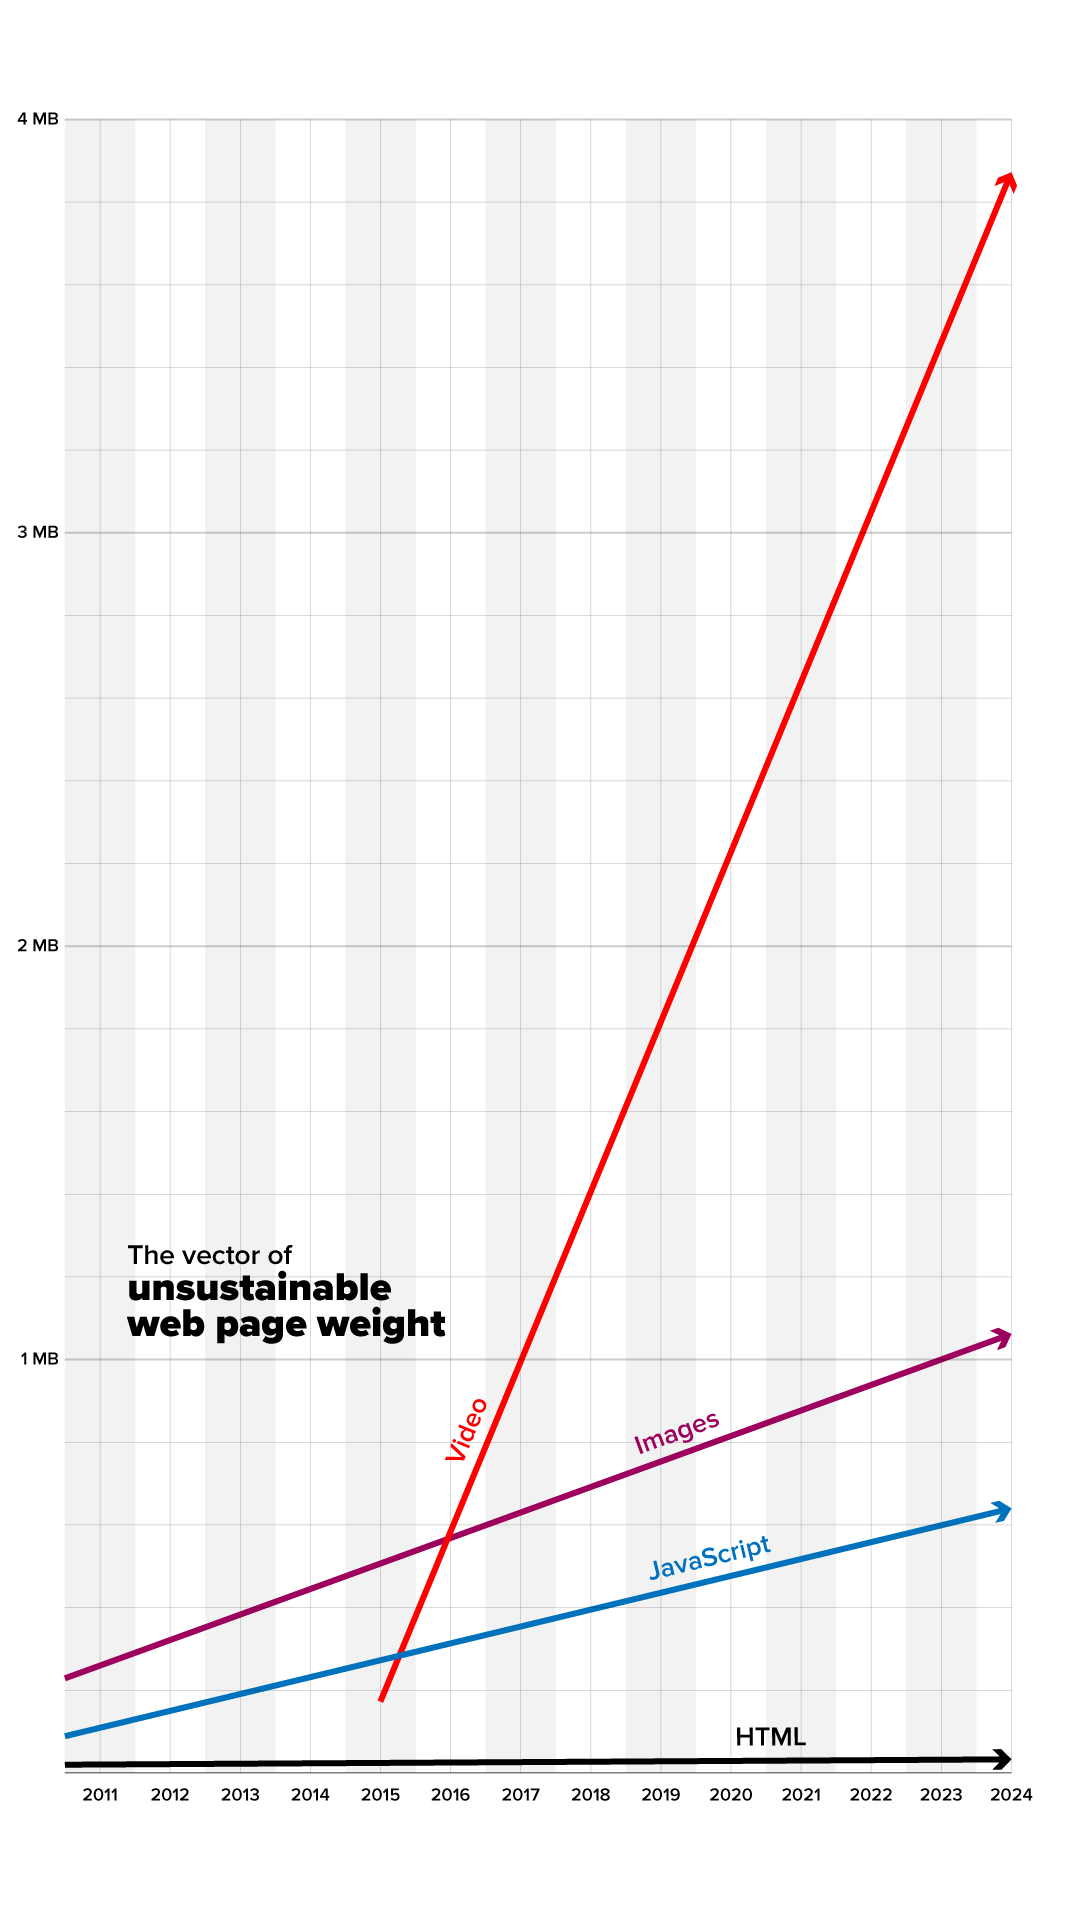
According to https://httparchive.org/reports/page-weight, the median weight in KB for web page tech on desktop:
Over the last 14.5 years:
HTML
2010: 20KB;
mid 2024: 33KB;
Increase of 65%.
Images
2010: 229KB;
mid 2024: 1,062KB;
Increase of 464%.
JavaScript
2010: 89KB;
mid 2024: 640KB;
Increase of 719%.
- - -
Over the last 9 years:
Video
mid 2015: 173KB;
mid 2024: 3,872KB;
Increase of 2,238%.
I reckon that in the era of AI the JS gradient is gonna steepen significantly
Family on east coast: 10F below average
Me on west coast: 20F above average
Family on east coast: 10F below average
Me on west coast: 20F above average
Brilliant episode.
Do yourself a favour and get a half-hour heads up on the shape of where we are going
If only people had known that having 10% more moisture in the air would be a problem.
Oh well, let’s keep shooting for 20% for the sake of GDP (that will also get washed away)
It is mid-winter and IT IS COLDER HERE IN KOREA THAN IN ANCHORAGE, ALASKA!!!
I don’t think I’ve ever seen this before.
Another thing I’ve never seen before until today is the sight of my neighbor’s honeybees flying around our yard in January because the sunshine is so warm, it’s making them think it’s March.
😶
#climateDiary
The UK government has published a 12 page plus cover summary PDF of a much larger (as yet unpublished) report. The summary is entitled:
‘Global biodiversity loss, ecosystem collapse and national security’
Its lead page lists 7 key judgments, each with an Analytical Confidence Rating of high, moderate or low.
3 of the 7 are high.
The text of the judgments follows
#effingPDF: https://assets.publishing.service.gov.uk/media/696e0eae719d837d69afc7de/National_security_assessment_-_global_biodiversity_loss__ecosystem_collapse_and_national_security.pdf
7 continued (UK gov: moderate risk)
…Countries best placed to adapt are those that invest in ecosystem protection and restoration, and resilient and efficient food systems.
- - -
Low risk
5. There is a realistic possibility that some ecosystems (such as coral reefs in South East Asia and boreal forests) start to collapse from 2030, and others (rainforests and mangroves) start to collapse from 2050.
The above excerpted from the UK government’s PDF:
https://assets.publishing.service.gov.uk/media/696e0eae719d837d69afc7de/National_security_assessment_-_global_biodiversity_loss__ecosystem_collapse_and_national_security.pdf
…As a postscript to the above, I’ll just add that global heating of +1.5°C is arriving about 15 years ahead of the timing deemed probable in 2015, and that AMOC collapse is maybe 100 years ahead of earlier analysis.
Perhaps we might like to wake *the fuck* up about how economics orthodoxy is nudging us more insistently off the table https://mastodon.social/@urlyman/113418176951770714


