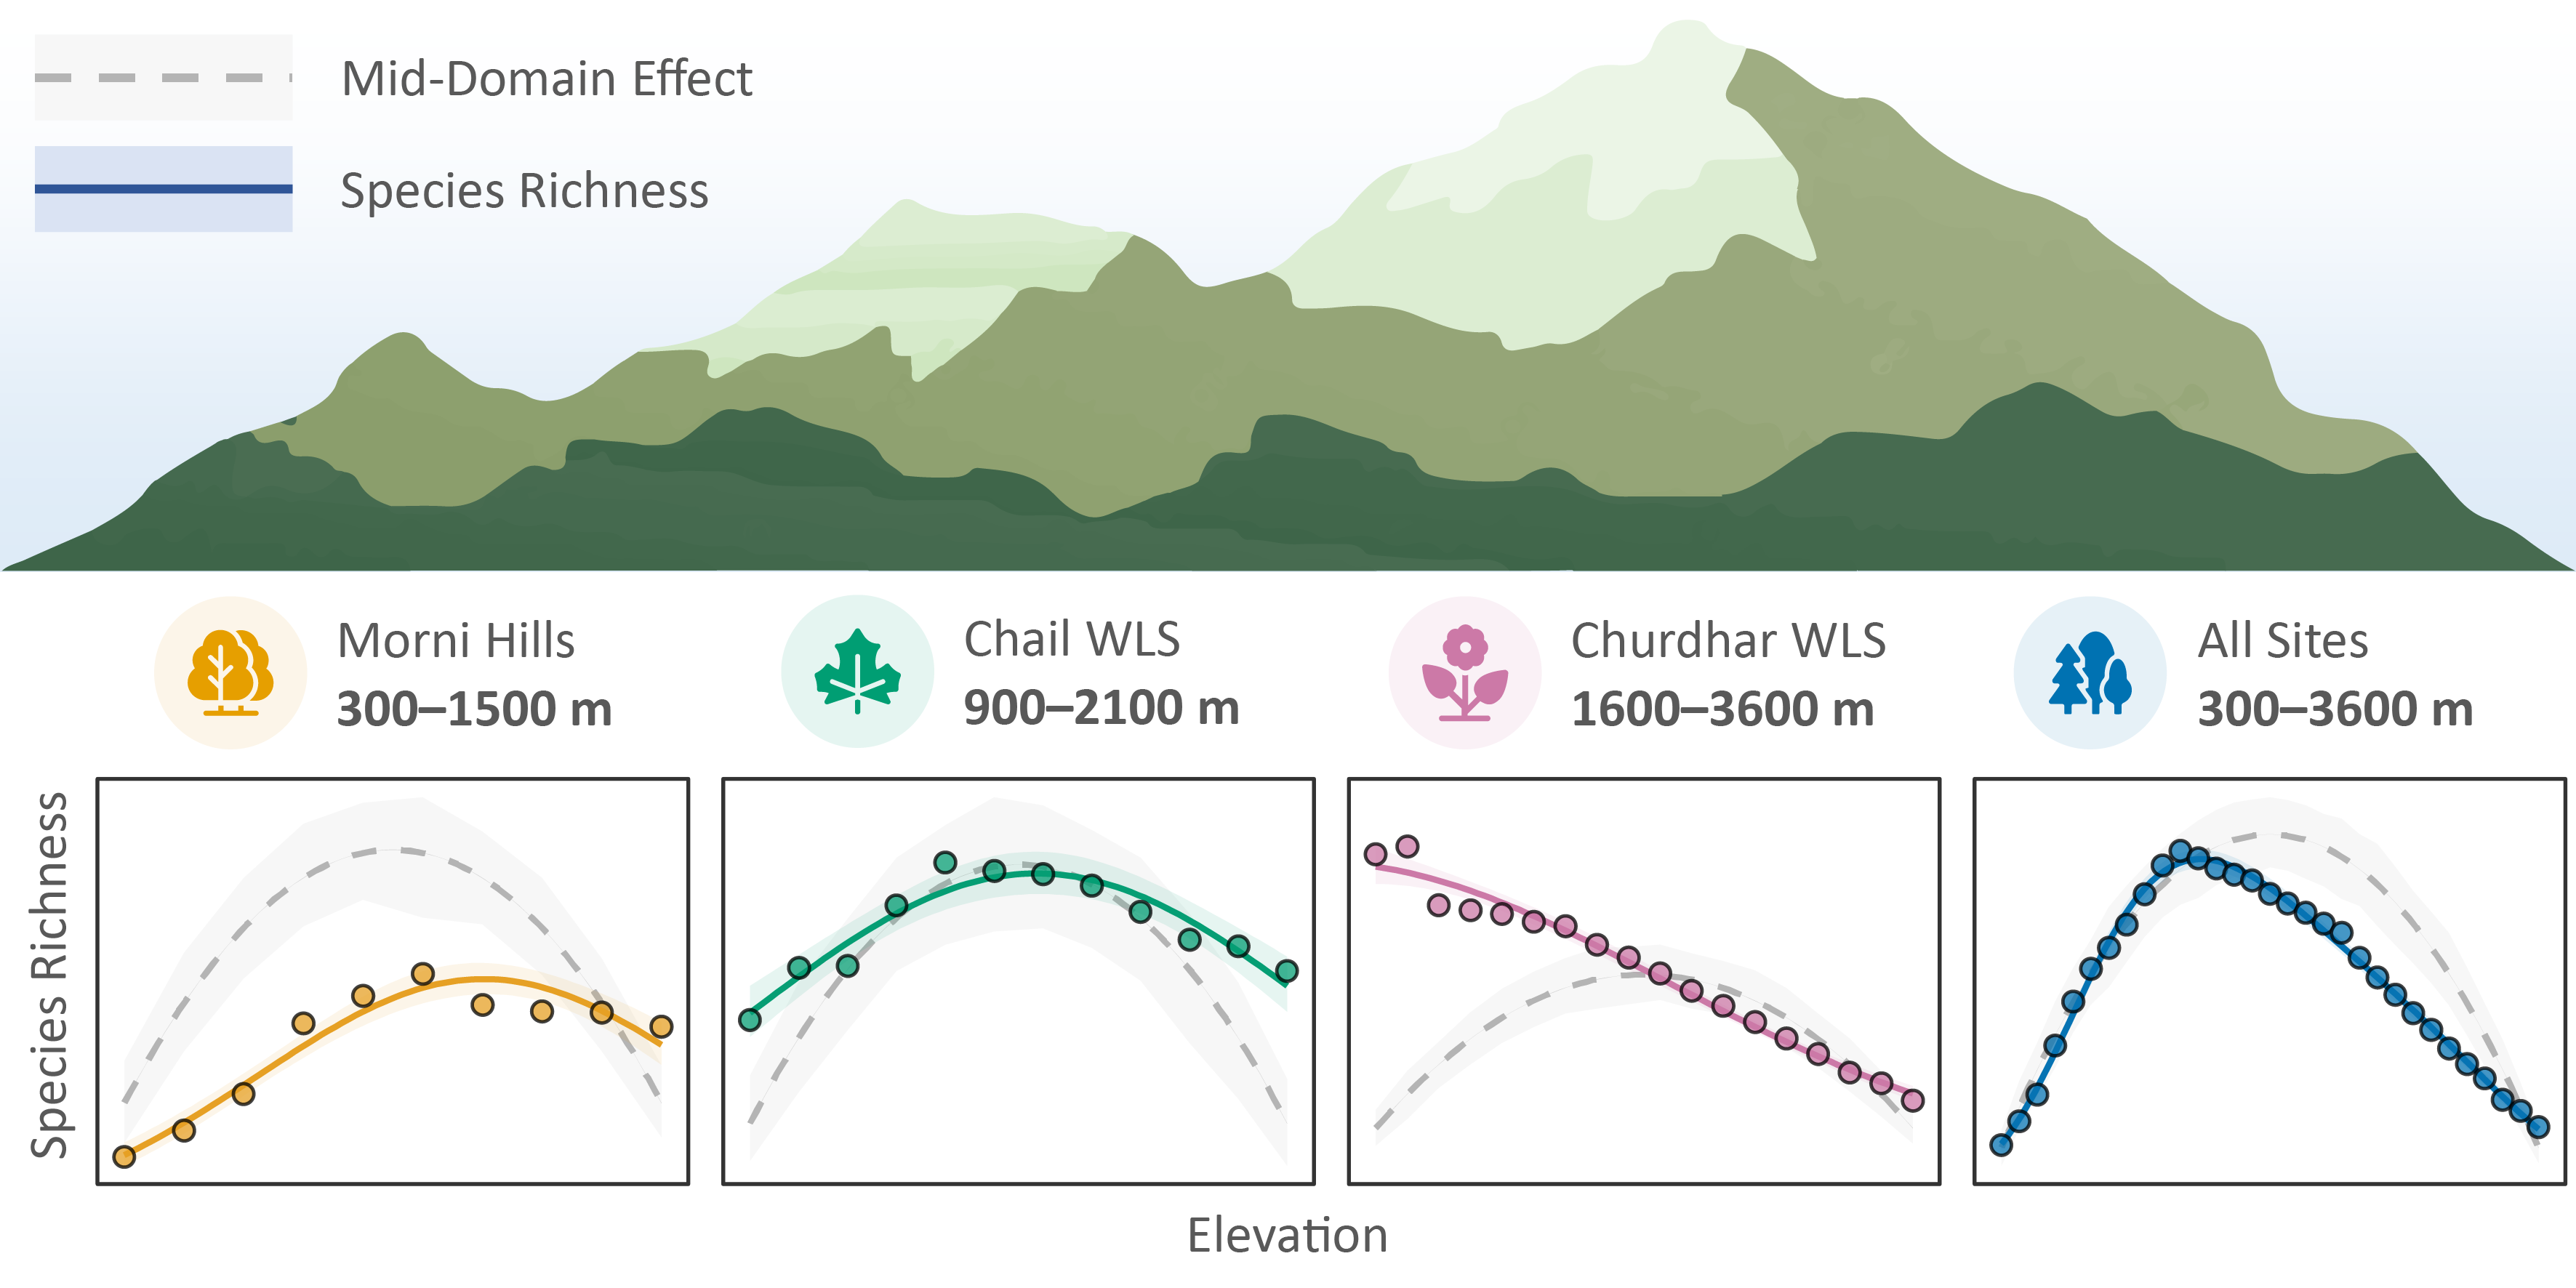
Illustration showing the relationship between plant species richness and elevation across three Himalayan sites and their combined pattern. The top panel depicts a stylized mountain range labeled with a legend for “Mid-Domain Effect” (gray dashed line) and “Species Richness” (solid blue line). Below, four small plots display species richness versus elevation for: (1) Morni Hills (300–1500 m, yellow), showing a unimodal increase and decline in richness; (2) Chail Wildlife Sanctuary (900–2100 m, green), showing a similar mid-elevation peak; (3) Churdhar Wildlife Sanctuary (1600–3600 m, pink), showing a gradual decline with elevation; and (4) all sites combined (300–3600 m, blue), showing a pronounced hump-shaped richness pattern centered at mid-elevations. The gray dashed curves represent predicted richness from the mid-domain effect, with shaded confidence bands.
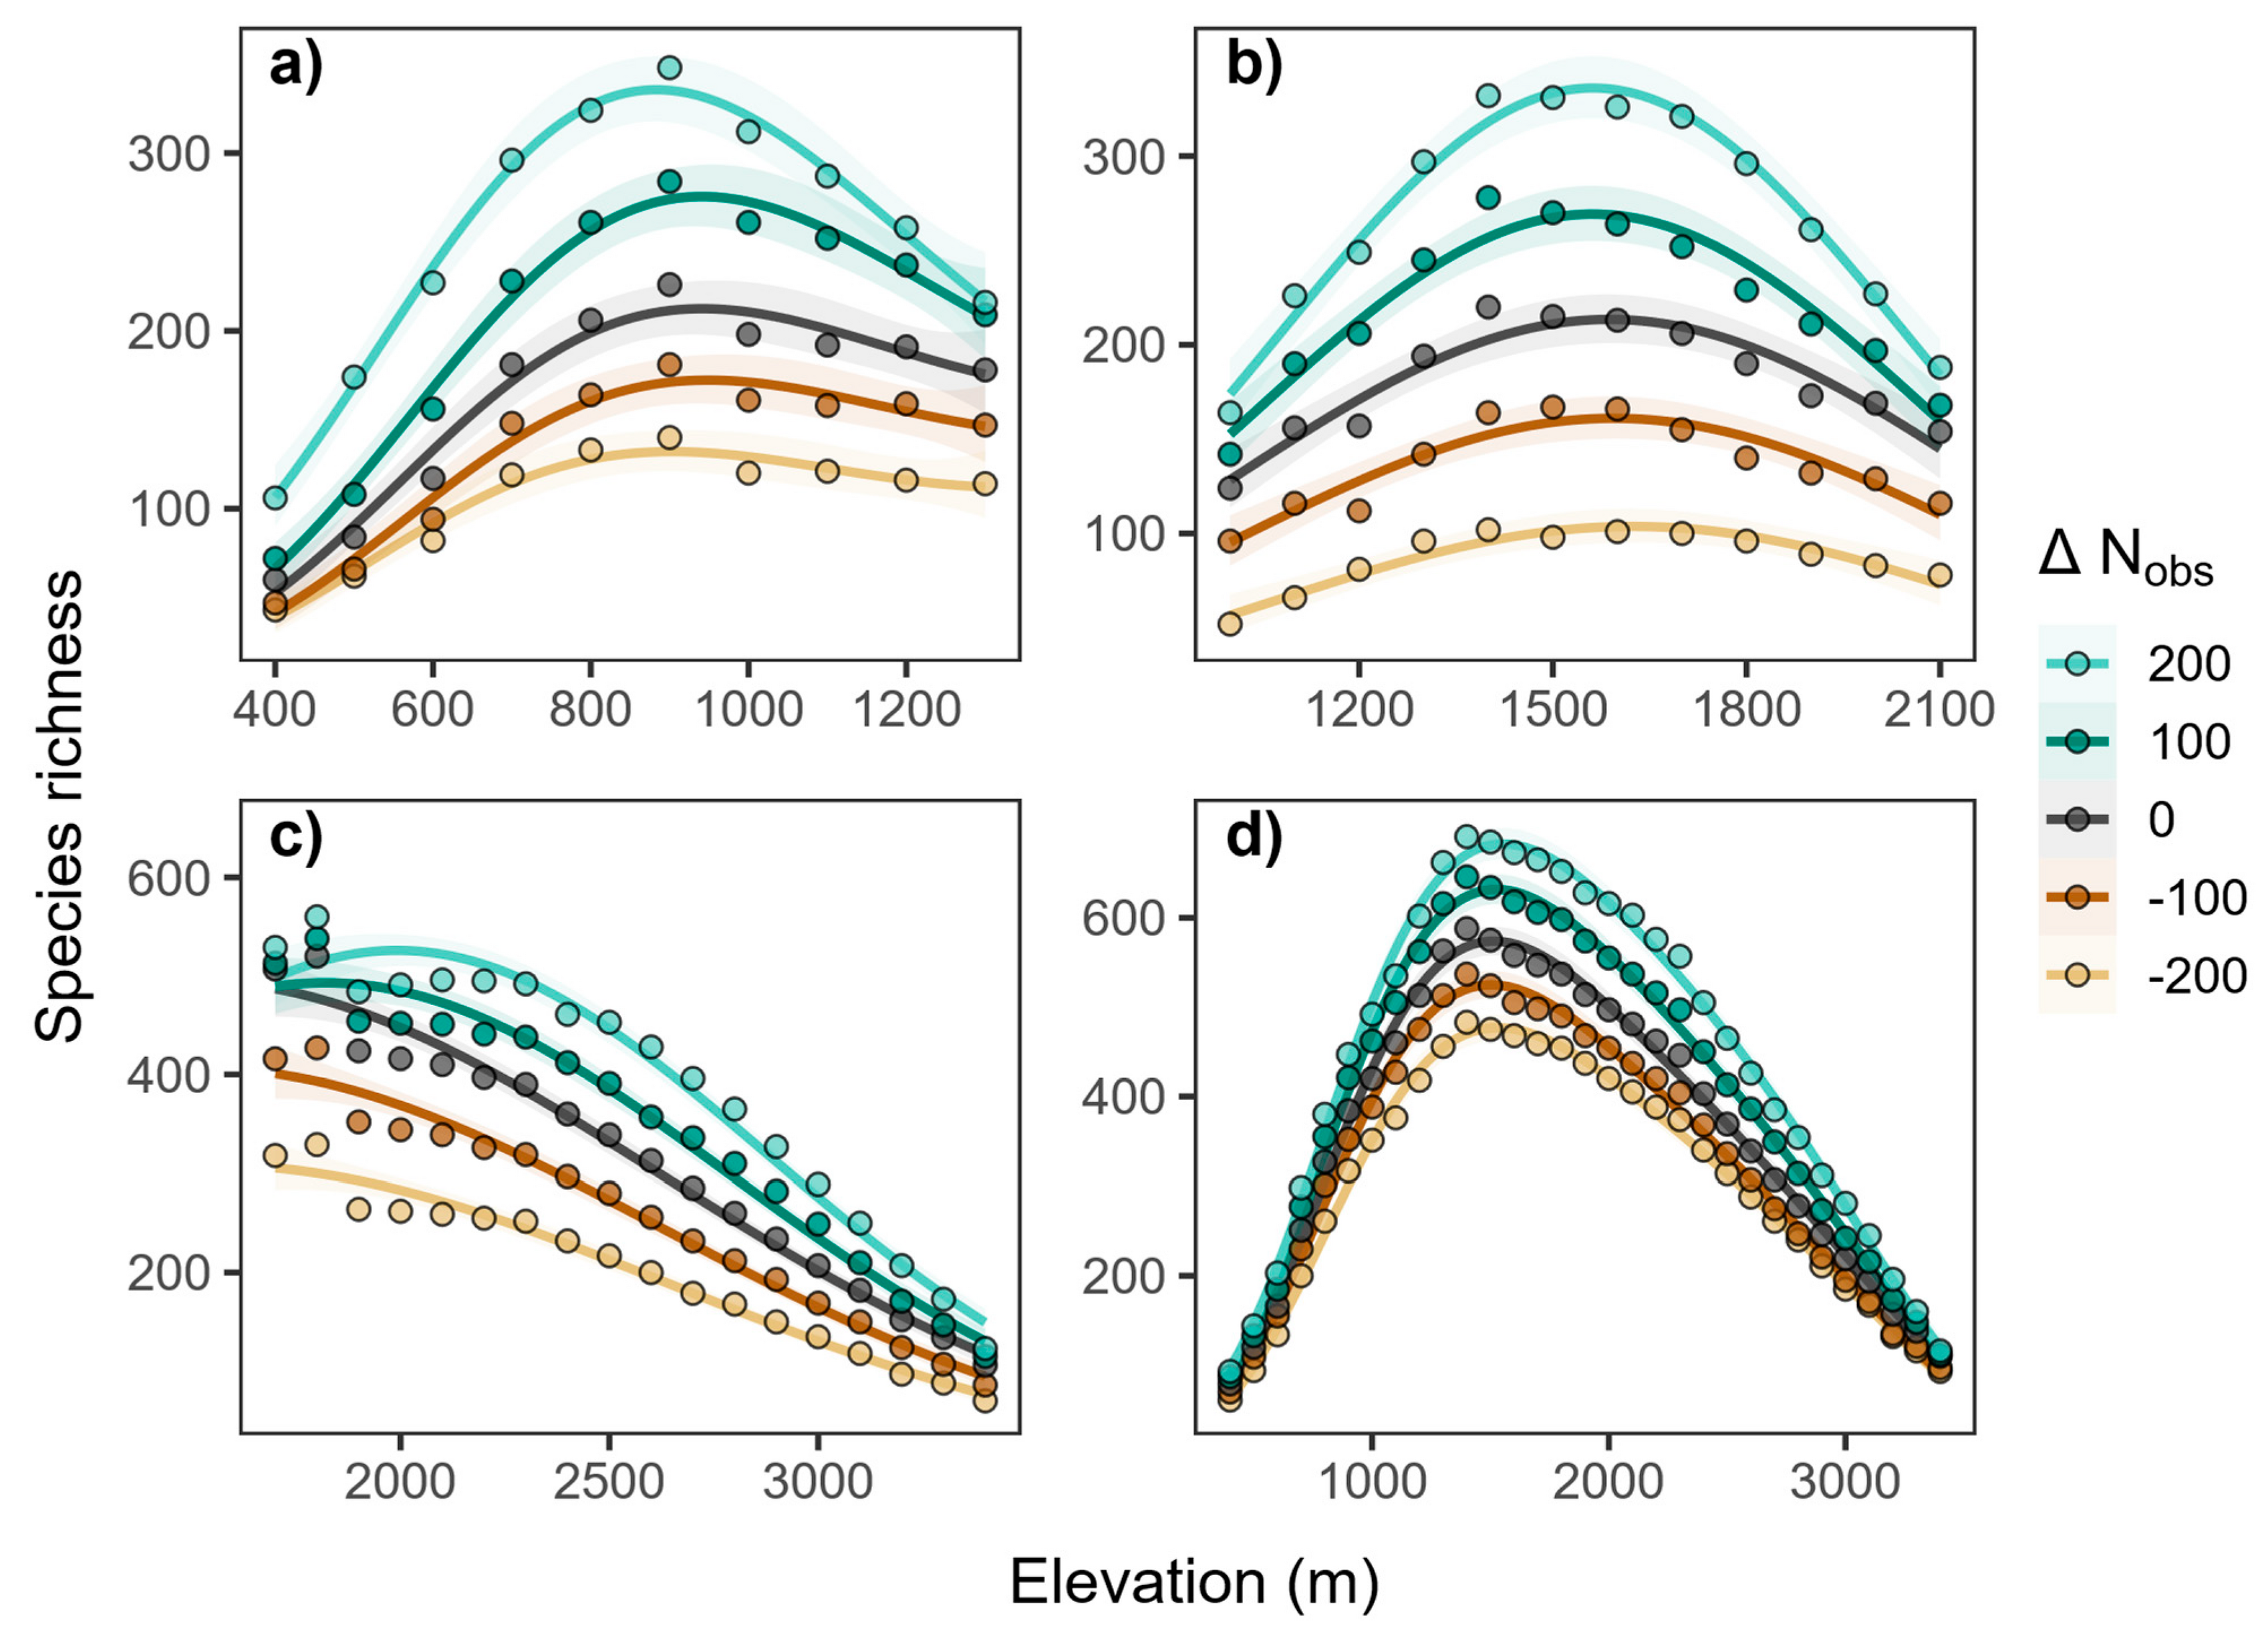
Four graphs (a-d) showing the relationship between Species richness (y-axis) and Elevation (m) (x-axis), with curves representing different total numbers of observed species ($\Delta N_{obs}$) relative to the mean across the study sites.The legend indicates five levels of $\Delta N_{obs}$: 200 (light teal), 100 (dark teal), 0 (dark gray), -100 (brown), and -200 (light orange).Plots a, b, and d show a hump-shaped relationship between richness and elevation, where richness peaks at intermediate elevations and decreases at lower and higher elevations.Plot c shows a decreasing relationship between richness and elevation.In all plots (a-d), a higher total number of observed species (positive $\Delta N_{obs}$) corresponds to a higher overall species richness at any given elevation.
Illustration showing the relationship between plant species richness and elevation across three Himalayan sites and their combined pattern. The top panel depicts a stylized mountain range labeled with a legend for “Mid-Domain Effect” (gray dashed line) and “Species Richness” (solid blue line). Below, four small plots display species richness versus elevation for: (1) Morni Hills (300–1500 m, yellow), showing a unimodal increase and decline in richness; (2) Chail Wildlife Sanctuary (900–2100 m, green), showing a similar mid-elevation peak; (3) Churdhar Wildlife Sanctuary (1600–3600 m, pink), showing a gradual decline with elevation; and (4) all sites combined (300–3600 m, blue), showing a pronounced hump-shaped richness pattern centered at mid-elevations. The gray dashed curves represent predicted richness from the mid-domain effect, with shaded confidence bands.