Cartoonjournaal 30 september 2025.
Lees het bijbehorende artikel op mijn LinkedIn profiel:
#eikels #rellen #bos #klimaatverandering #extreemrechts #weersextremen #wolf #voedselzekerheid #ecologie #natuur
Cartoonjournaal 30 september 2025.
Lees het bijbehorende artikel op mijn LinkedIn profiel:
#eikels #rellen #bos #klimaatverandering #extreemrechts #weersextremen #wolf #voedselzekerheid #ecologie #natuur
The bottom line is this: my new updated graph will only start to tell a different story from the original one, if we manage to bring down the annual growth rate of our CO2 emissions.
So please help me make my new graph useful, by breaking the system that causes the emissions to go up with a steady 2.84% per year.
#EarthSciences#ClimateScience#ClimateChange#Aardwetenschappen#ClimateDiary#Klimaatverandering#CambioClimático @davidho
2/2
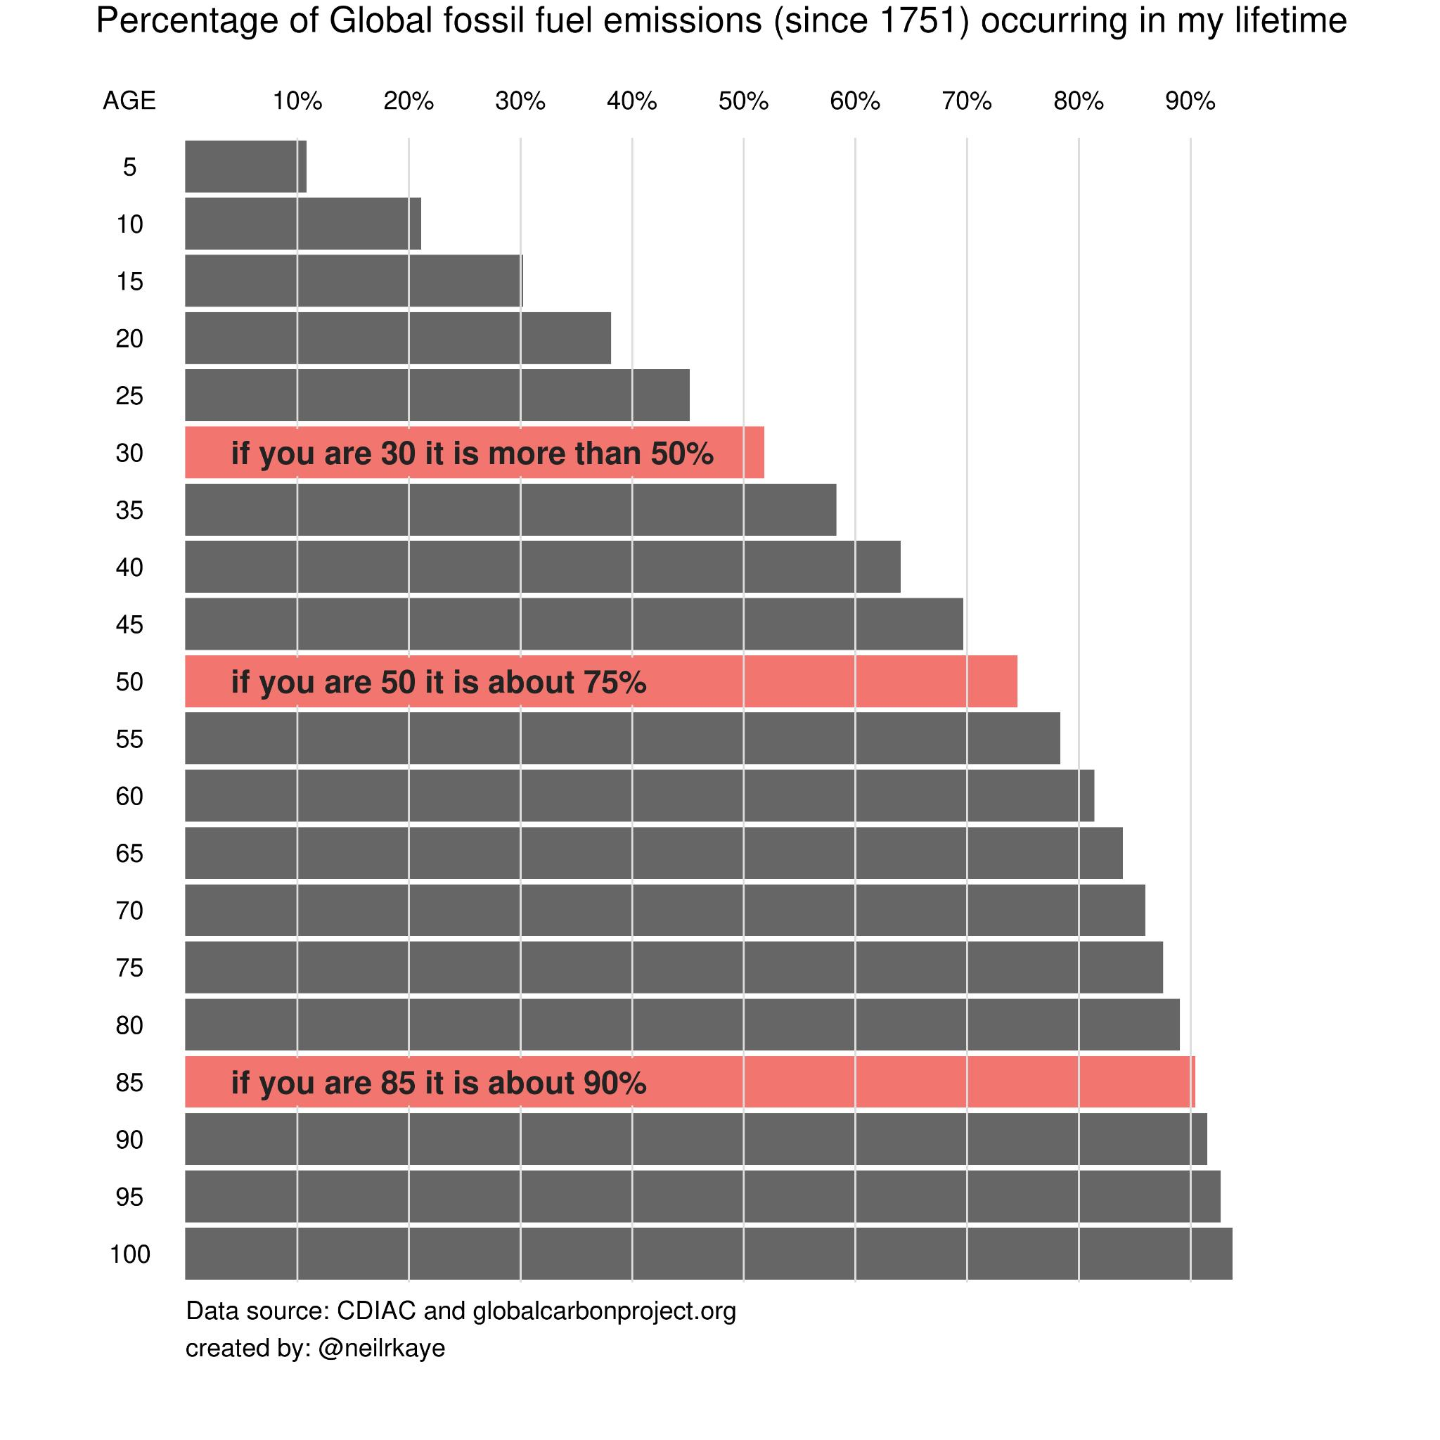
Almost one year ago I wrote a post about this famous graph.
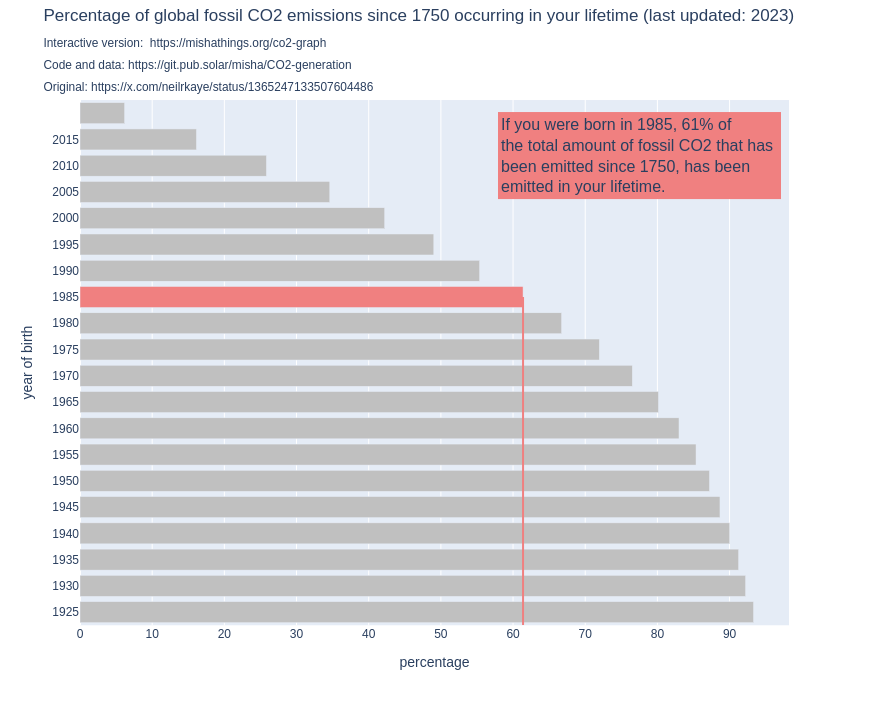
I decided to build an interactive alternative that is more transparant and can be easily updated with more recent data: https://mishathings.org/co2-graph
Yet today I found myself wondering: do we actually expect this graph to change over time?
This led me to quite a rabbit hole. I invite you all to come have a look: https://mishathings.org/pages/co2-graph-ratios.html
Or, if you are not in the mood for math or python, read the summary: https://mishathings.org/posts/2024-08-12-how-much-co2-has-been-emitted-in-my-lifetime/ )
1/2
The bottom line is this: my new updated graph will only start to tell a different story from the original one, if we manage to bring down the annual growth rate of our CO2 emissions.
So please help me make my new graph useful, by breaking the system that causes the emissions to go up with a steady 2.84% per year.
#EarthSciences#ClimateScience#ClimateChange#Aardwetenschappen#ClimateDiary#Klimaatverandering#CambioClimático @davidho
2/2
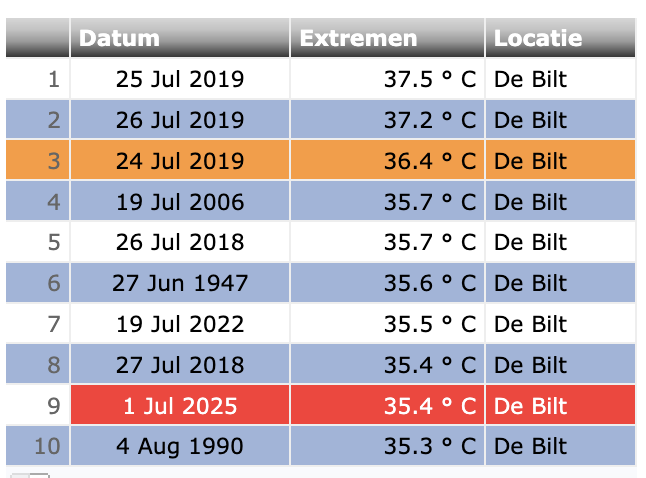
Vandaag staat nu in de top-10 van warmste dagen ooit gemeten in De Bilt. Ook bijna overal in het zuiden van het land staat deze dag nu in de top-10 van warmste dagen ooit. #klimaatverandering
In de top 10 staan 2 dagen uit de 20e eeuw. De andere 8 dagen zijn van de laatste 20 jaar.
Vandaag staat nu in de top-10 van warmste dagen ooit gemeten in De Bilt. Ook bijna overal in het zuiden van het land staat deze dag nu in de top-10 van warmste dagen ooit. #klimaatverandering
In de top 10 staan 2 dagen uit de 20e eeuw. De andere 8 dagen zijn van de laatste 20 jaar.
"HERINNERING voor iedereen die nog niet de raadpleging voor het nationaal #burgerberaad #klimaat heeft ingevuld. Dit kan nog t/m vandaag 7 mei via onderstaande link. Meedoen is belangrijk! Er zijn signalen dat de #raadpleging veel wordt ingevuld door mensen uit de CLINTEL/industrie-hoek en dat mensen die zich daadwerkelijk zorgen maken over #klimaatverandering de raadpleging minder goed weten te vinden. 🙏"
https://www.burgerberaadpleging.nl/
Vraag: Zijn er nog andere zaken waar het burgerberaad rekening mee moet houden?
Antwoord: Clintel liegt.
😈😂😉✅


