Megan ⚘
and 1 other
boosted

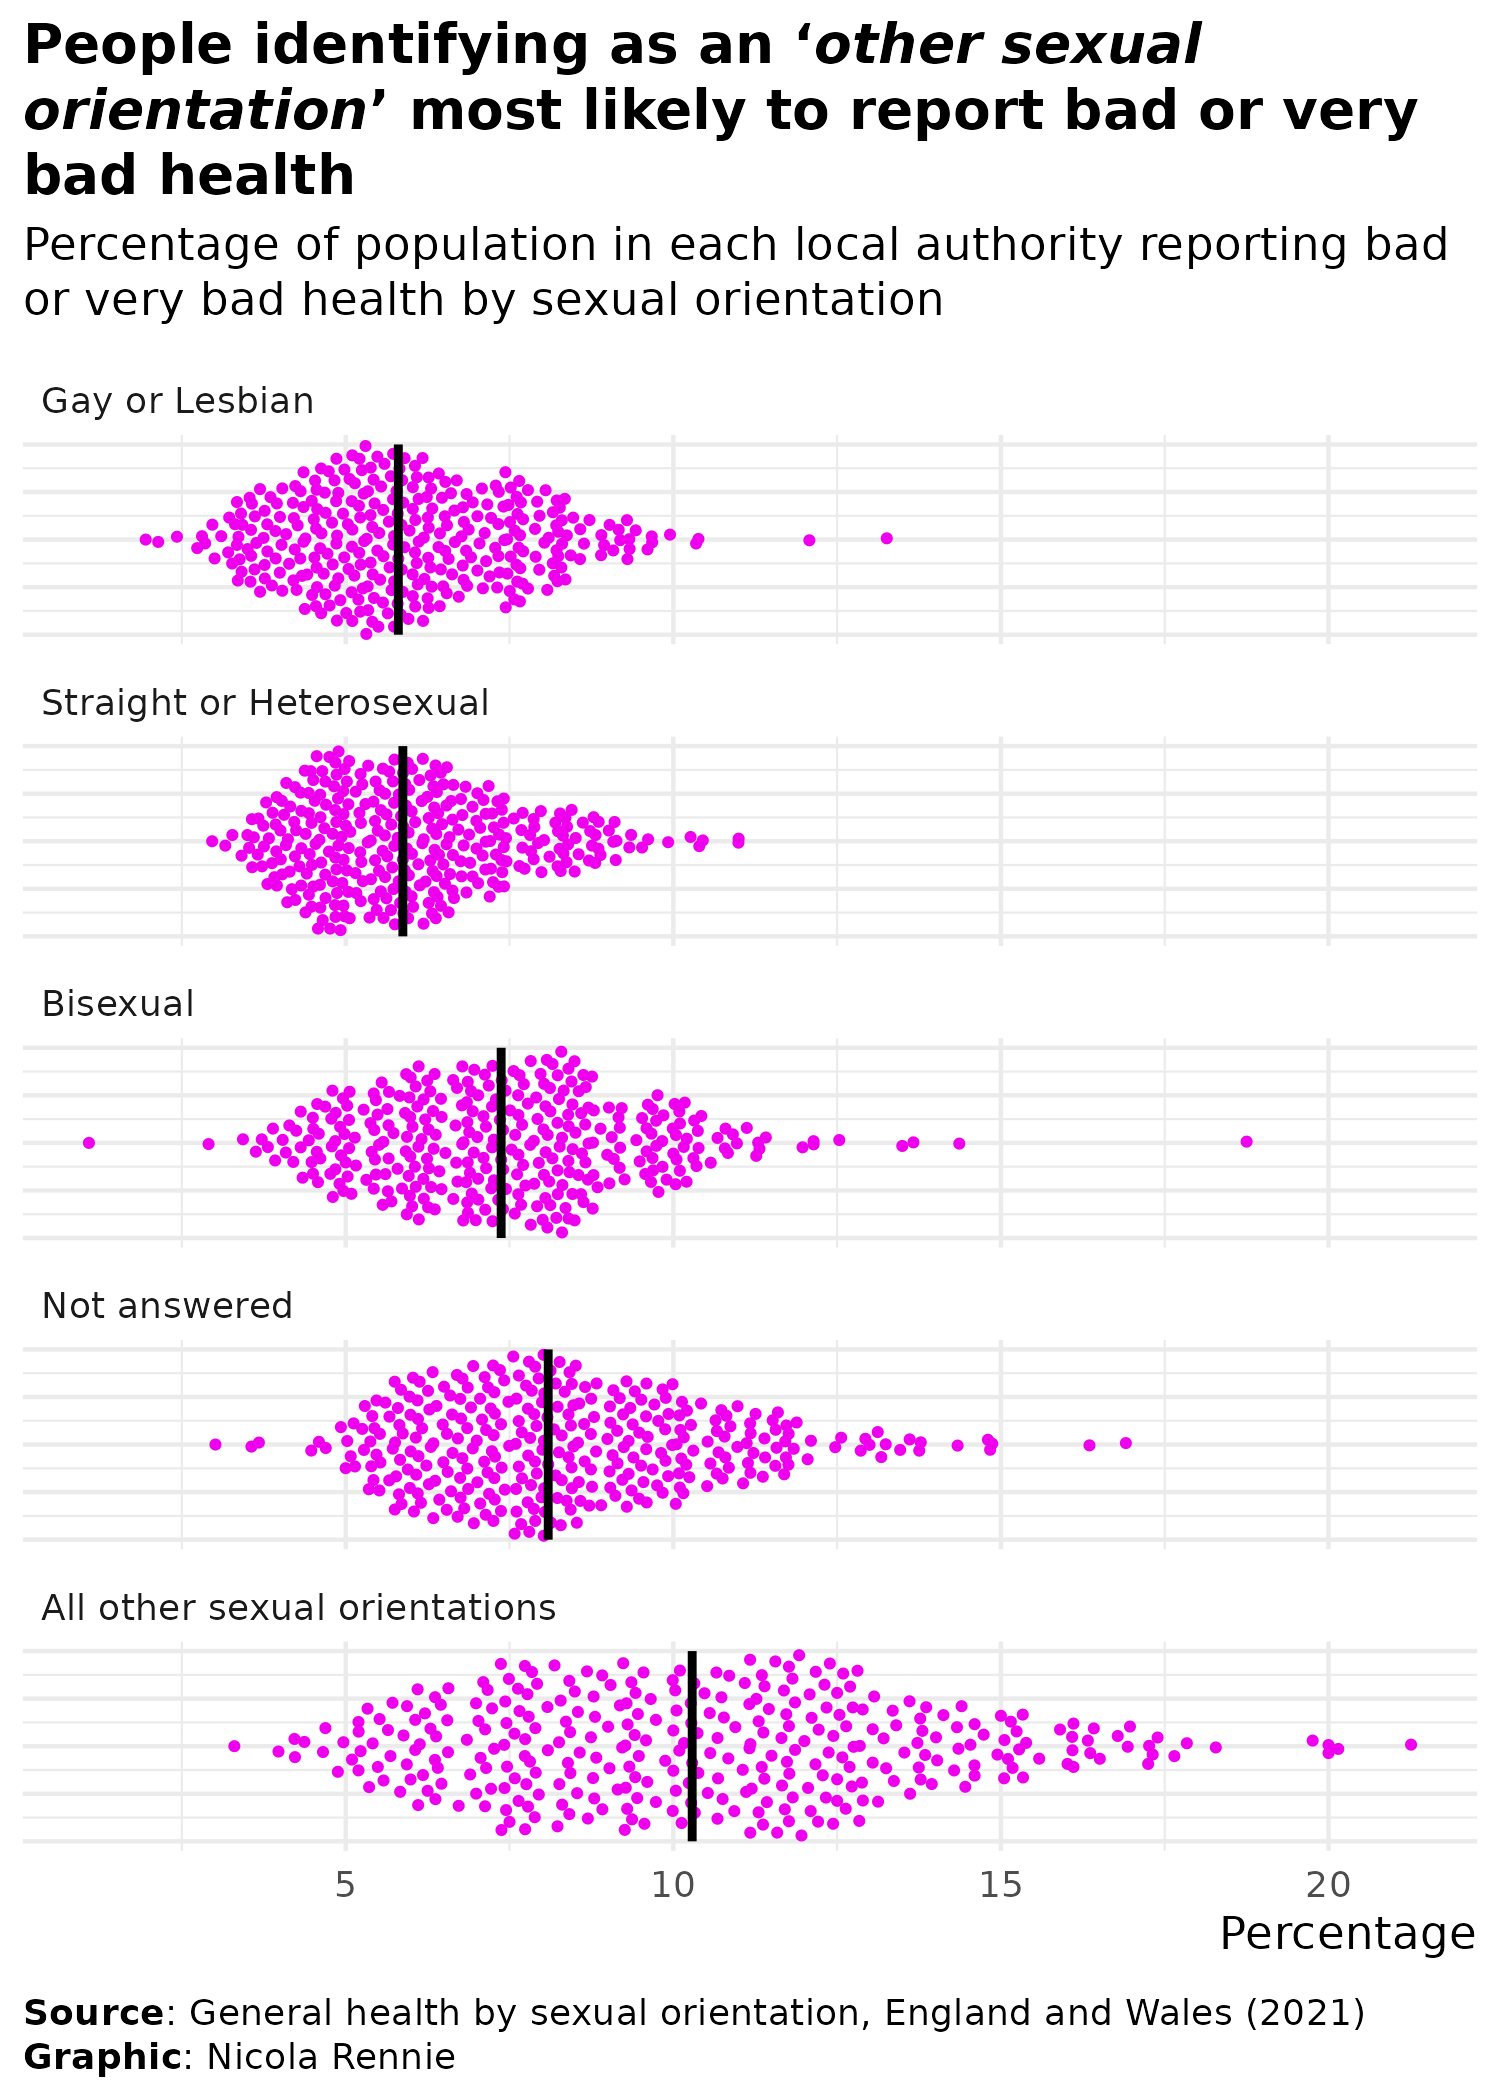
Inspired by #TidyTuesday & LGBTQ+ History Month myself and Kirstie Ken English are challenging people to produce visualisations using UK census data on LGBTQ+ people 📊
Share your #DataViz and code via GitHub or on here using #VisLGBTQ
Here's one we made in today's @rainbowR workshop 🐝
More data and some example code to get you started on GitHub: https://github.com/nrennie/rainbowR-VisLGBTQ