Day 29. Raster
#30DayMapChallenge
Between Two Octobers (2012-2025)
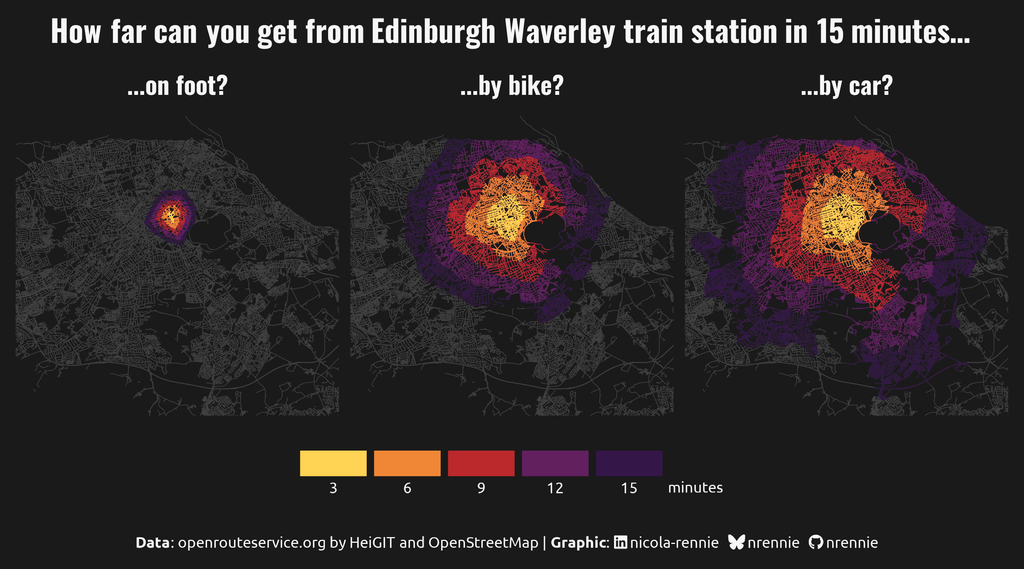
Mapping out how quickly you can get around Edinburgh with different modes of transport for day 26 of the #30DayMapChallenge!
Useful blog post if you want to try this yourself: https://jamiehudson.netlify.app/post/distance_map/
One of the things that has been on my to do list for a very long time, is building a gallery of all of the charts I've made across #TidyTuesday, #30DayChartChallenge, #30DayMapChallenge, and other miscellaneous projects 📊
And it's finally here!
What does summer feel like where you live? Hot or cool? Rainy or dry? For the #30daymapchallenge Day 25 prompt "Hexagons", I mapped summer climates across North America. I averaged the 1991-2020 climate normals for mean summer temperature and total summer precipitation within 50,000 square kilometer hexagons using data from ClimateNA.
Day 29. Raster
#30DayMapChallenge
Between Two Octobers (2012-2025)
Mapping out how quickly you can get around Edinburgh with different modes of transport for day 26 of the #30DayMapChallenge!
Useful blog post if you want to try this yourself: https://jamiehudson.netlify.app/post/distance_map/
What does summer feel like where you live? Hot or cool? Rainy or dry? For the #30daymapchallenge Day 25 prompt "Hexagons", I mapped summer climates across North America. I averaged the 1991-2020 climate normals for mean summer temperature and total summer precipitation within 50,000 square kilometer hexagons using data from ClimateNA.
#30DayMapChallenge Day 24: Places and their names
I downloaded 84,513 German settlements (cities, towns, villages, hamlets) from OpenStreetMap and analyzed their suffixes. The classification was based on an article from Wikipedia.
One of the things that has been on my to do list for a very long time, is building a gallery of all of the charts I've made across #TidyTuesday, #30DayChartChallenge, #30DayMapChallenge, and other miscellaneous projects 📊
And it's finally here!
#30DayMapChallenge Day 24: Places and names. I've always wanted to make a Portolan Chart. Here's #GulfofMexico portolan style
The Spilhaus projection can tessellate the plane.
Here are two examples with 4x4 and 8x8 using the image from the #30DayMapChallenge
#30DayMapChallenge Day 24: Places and their names
I downloaded 84,513 German settlements (cities, towns, villages, hamlets) from OpenStreetMap and analyzed their suffixes. The classification was based on an article from Wikipedia.
#30DayMapChallenge Day 24: Places and names. I've always wanted to make a Portolan Chart. Here's #GulfofMexico portolan style
The Spilhaus projection can tessellate the plane.
Here are two examples with 4x4 and 8x8 using the image from the #30DayMapChallenge
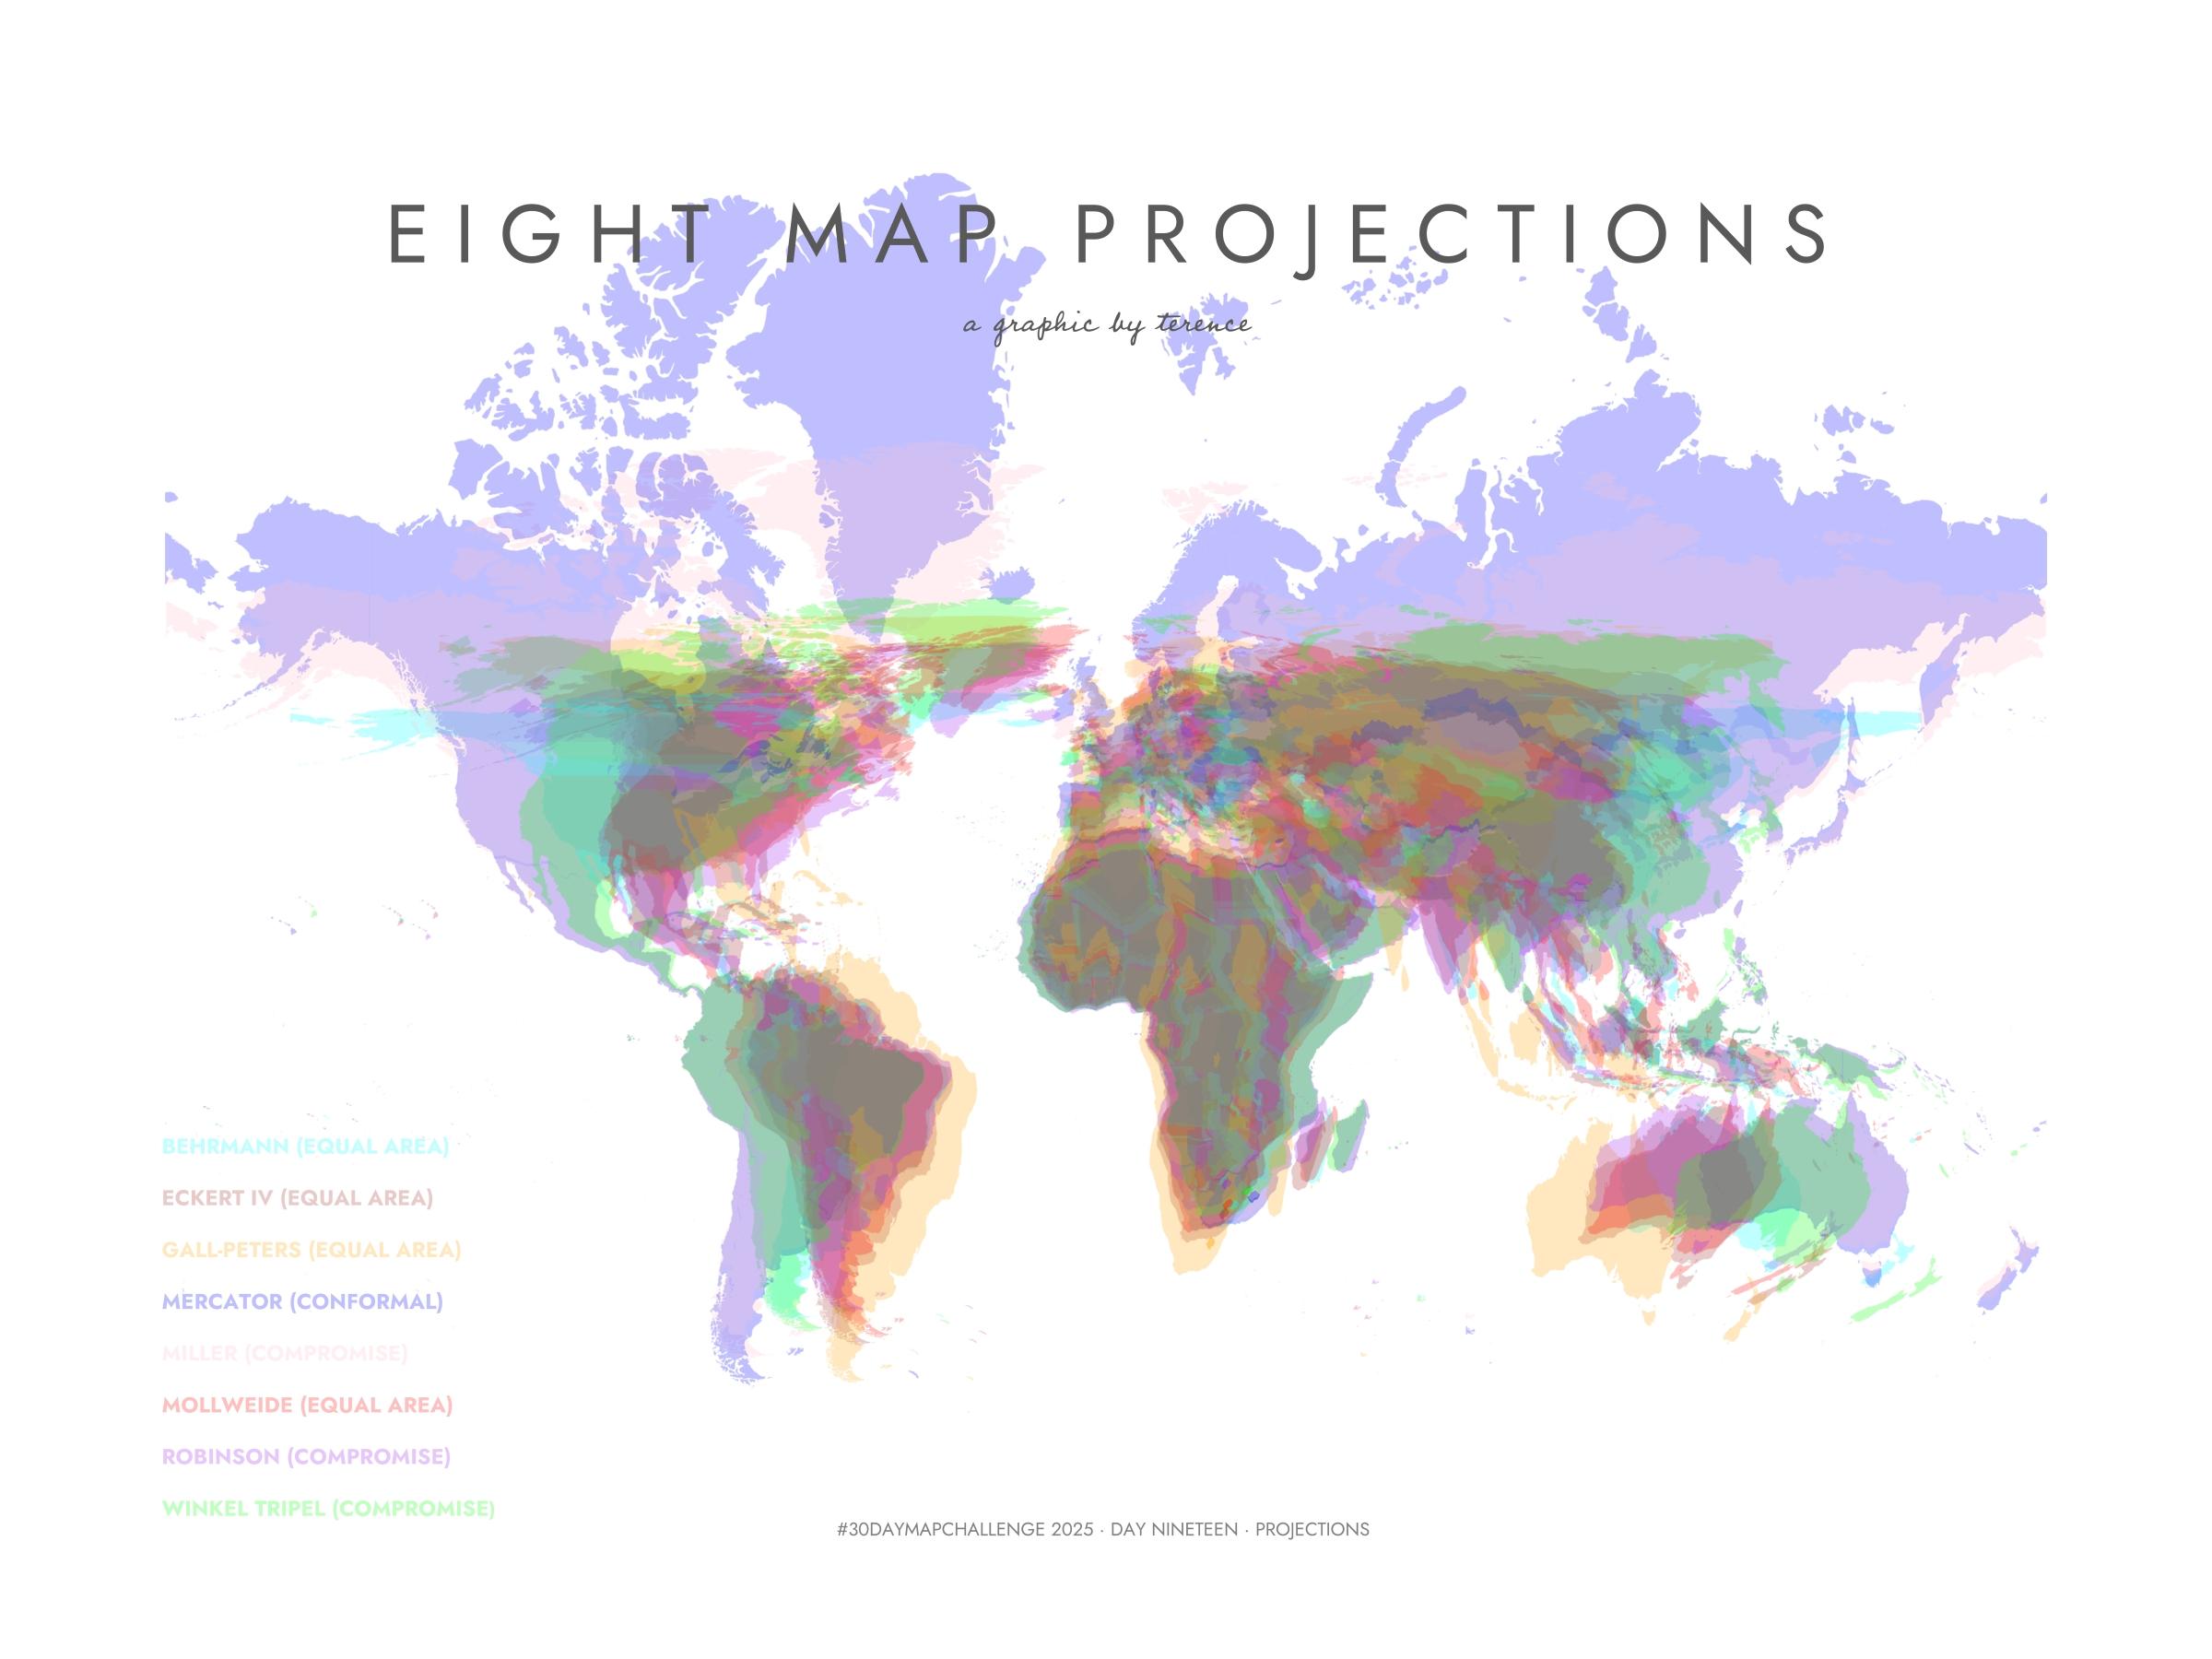
#30DayMapChallenge · Day 19 · Projections. Here's a visualisation of eight map projections.
#30DayMapChallenge Day 20: Water
World map using the Spilhaus projection. The oceans form a single mass of water around Antarctica.
#30DayMapChallenge · Day 19 · Projections. Here's a visualisation of eight map projections.
#30DayMapChallenge Day 18: Out Of This World
I used several Python libraries, including skyfield, to recreate the current constellation of stars above me in the night sky.


