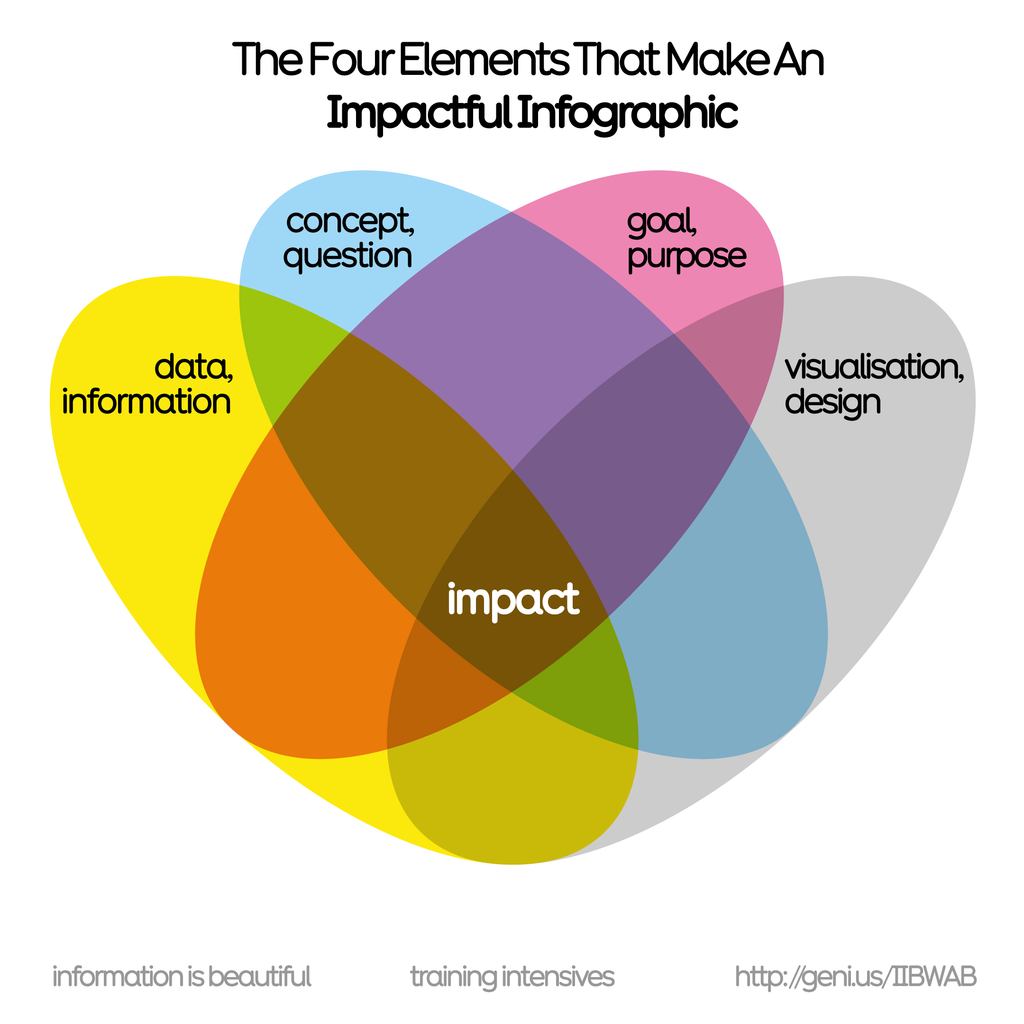
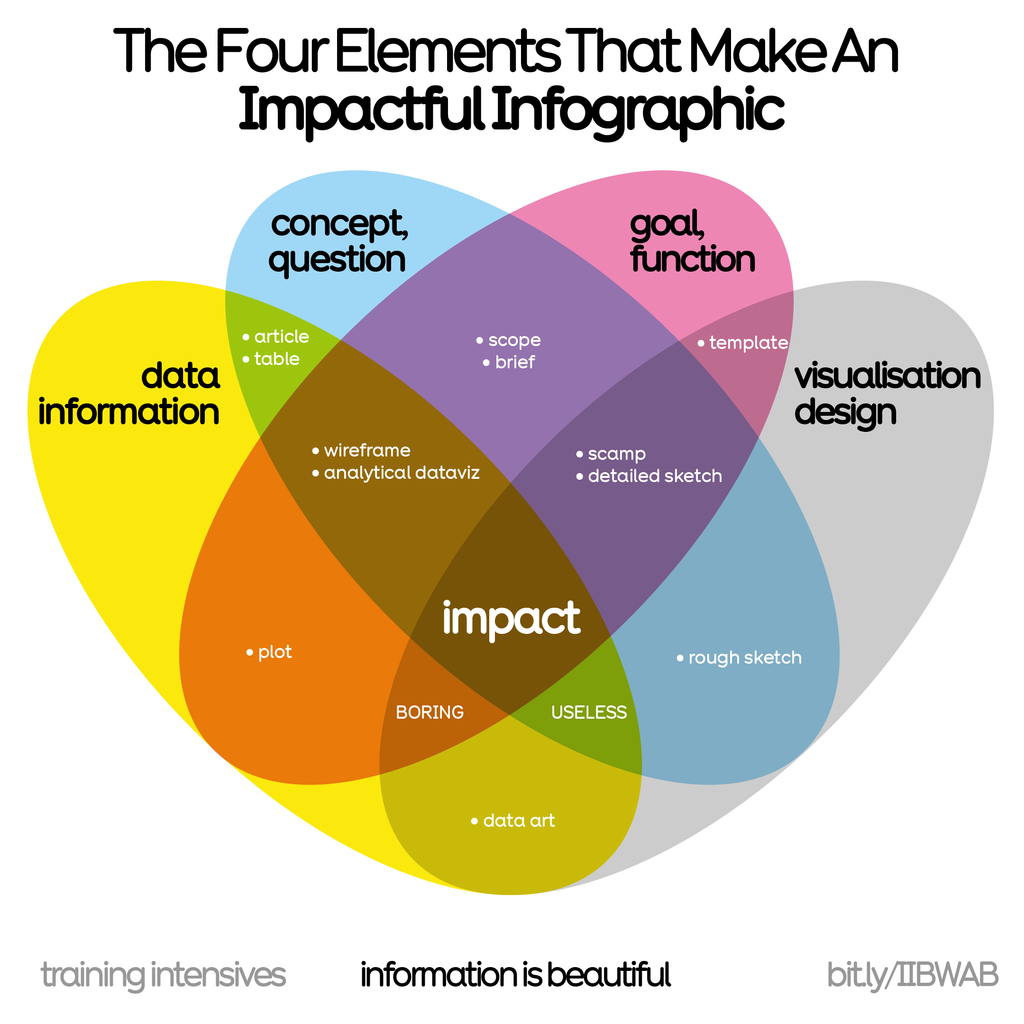
We use this prism in our workshops to help create an impactful, communicable, beautiful #infographic
Learn more in our forthcoming seminars:
2 x virtual half days:
25th & 26th Mar 🇬🇧 UK/EU/AUS
29th & 30th Apr 🇺🇸 USA timezone
Mon 27th Apr 🇬🇧 LDN in-person
https://bit.ly/IIBWAB #iibwab
Reviews: https://geni.us/WABreviews