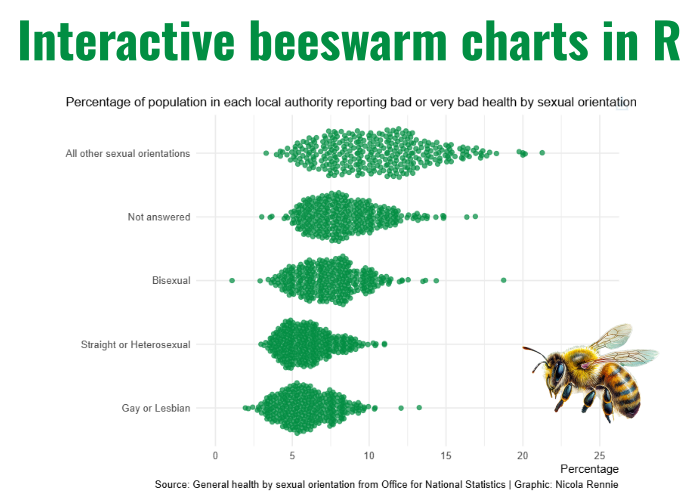
Nicola Rennie @nrennie@fosstodon.org · activity timestamp 22 hours ago One of the questions in our @rainbowR 📊 workshop, was "could you make the beeswarm chart interactive?" 🐝 The answer is yes you can and here's how: https://nrennie.rbind.io/blog/interactive-beeswarm-r/ #RStats #DataViz #ggplot2 #VisLGBTQ Read more Read less Translate Translate Nicola Rennie Interactive beeswarm charts in R – Nicola Rennie Interactive beeswarm charts are a great way to show distributions whilst still allowing users to see individual data points. This blog post shows how to make them entirely in R. Reply Boost or quote Boost Quote You cannot quote this post Like More actions Copy link Flag this post Block