Discussion
Loading...

Post

Log in
  • About
  • Code of conduct
  • Privacy
  • Users
  • Instances
  • About Bonfire
Ika Makimaki
Ika Makimaki
@pezmico@mastodon.nz  路  activity timestamp 3 hours ago

Jones responding to our polling with some misleading info:
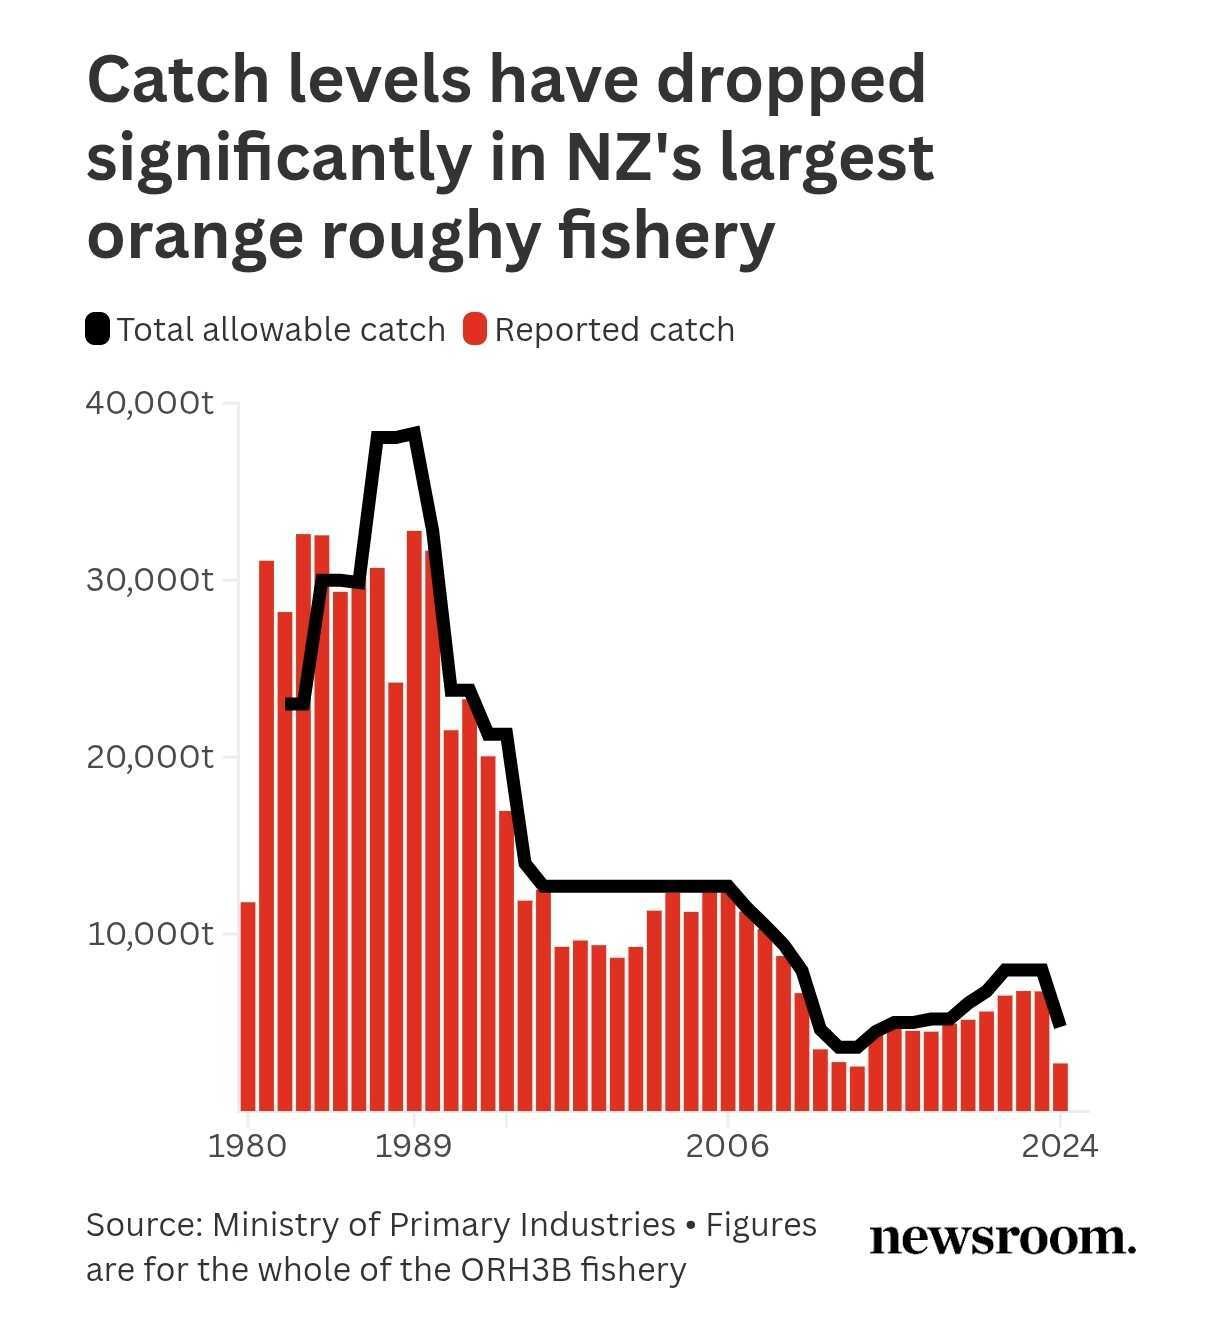
馃悷 1000 ton would be less than half of the reported catch in one fisheries area from 2024, the one considered to be collapsing. If that is all that remains then things are truly dire!
馃悷 What are these "other nations that are there" that he speaks of? Only New Zealand bottom trawls in the south pacific high seas. Therefore we have the WORST track record using the MOST DESTRUCTIVE method available.
Sick of the implied and reflexive "racism as a defense" NZFirst is so fond of.

Minister defends bottom trawling, despite poll showing majority of NZers want it banned
https://www.rnz.co.nz/international/pacific-news/587141/minister-defends-bottom-trawling-despite-poll-showing-majority-of-nzers-want-it-banned

#NZPol #BanBottomTrawling #ProtectTheOcean #oceans #fisheries

  • Copy link
  • Flag this post
  • Block
Future Sprog
Future Sprog
@futuresprog@mastodon.nzoss.nz  路  activity timestamp 2 hours ago

Worth remembering that Jones took $5,000-$10,000 from a fishing company a few years back.

He鈥檚 prepared to sell out all coral reefs for a very small amount of money.

https://mastodon.nzoss.nz/@futuresprog/115997809351254394

@pezmico #NZpol

  • Copy link
  • Flag this comment
  • Block
Ika Makimaki
Ika Makimaki
@pezmico@mastodon.nz  路  activity timestamp 3 hours ago

For reference, this is the reported catch in just one of the fisheries management areas, currently considered to be collapsed.

See where 1000 ton would figure?
yeah, not good.

#NZpol #fisheries #BanBottomTrawling #ProtectTheOcean

Catch levels have dropped
significantly in NZ's largest
orange roughy fishery
Graph of  Total allowable catch  and Reported catch
Y range goes up to 40,000t (allowed but never caught)
X range starts in1980 and ends in 2024

The highest catch was above 30000 ton in the 80s and 90s, then a quick and ongoing decline with last year barely approaching 3000 ton.

Source: Ministry of Primary Industries 芦 Figures are for the whole of the ORH3B fishery
Newsroom.
Catch levels have dropped significantly in NZ's largest orange roughy fishery Graph of Total allowable catch and Reported catch Y range goes up to 40,000t (allowed but never caught) X range starts in1980 and ends in 2024 The highest catch was above 30000 ton in the 80s and 90s, then a quick and ongoing decline with last year barely approaching 3000 ton. Source: Ministry of Primary Industries 芦 Figures are for the whole of the ORH3B fishery Newsroom.
  • Copy link
  • Flag this comment
  • Block

bonfire.cafe

A space for Bonfire maintainers and contributors to communicate

bonfire.cafe: About 路 Code of conduct 路 Privacy 路 Users 路 Instances
Bonfire social 路 1.0.2-alpha.29 no JS en
Automatic federation enabled
Log in
  • Explore
  • About
  • Members
  • Code of Conduct