Discussion
Loading...

Post

Log in
  • About
  • Code of conduct
  • Privacy
  • Users
  • Instances
  • About Bonfire
devSJR :python: :rstats:
@devSJR@fosstodon.org  ·  activity timestamp last month

@LabPlot@floss.social
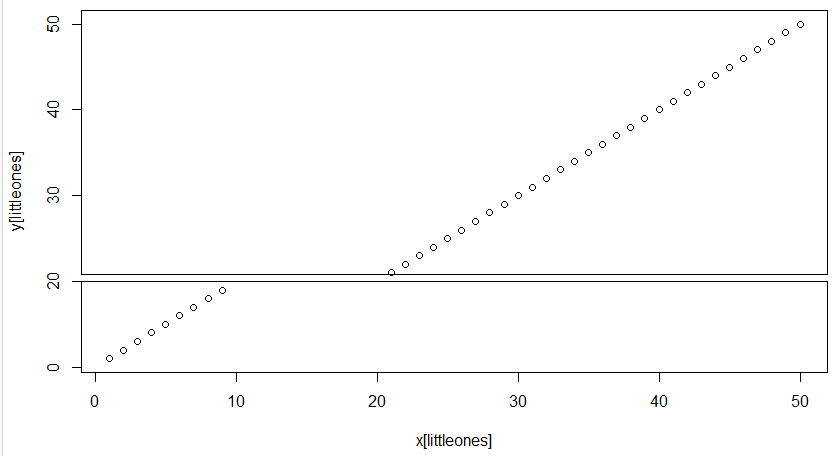
Hey Labplot, I'm asking for a friend. Can #Labplot do gap axises like #rstats #plotrix or #python #matplotlib?
@labplot@lemmy.kde.social @opensource

Scientific diagram showing a gap on the y-axis between two values. The plot is created using the plotrix package with the gap.plot function.
  • Copy link
  • Flag this post
  • Block
LabPlot
LabPlot
@LabPlot@floss.social replied  ·  activity timestamp last month

@devSJR @labplot@lemmy.kde.social @opensource

"Axis breaks" is not finalized yet on our side but we plan to add this feature in one of the next releases. Greetings to your friend and thanks for asking!

  • Copy link
  • Flag this comment
  • Block
devSJR :python: :rstats:
@devSJR@fosstodon.org replied  ·  activity timestamp last month

@LabPlot@floss.social
This is a great info. I will tell her. Thanks, keep up the good work.
@labplot@lemmy.kde.social @opensource

  • Copy link
  • Flag this comment
  • Block

bonfire.cafe

A space for Bonfire maintainers and contributors to communicate

bonfire.cafe: About · Code of conduct · Privacy · Users · Instances
Bonfire social · 1.0.1-beta.35 no JS en
Automatic federation enabled
Log in
  • Explore
  • About
  • Members
  • Code of Conduct