Discussion
Loading...

#Tag

  • About
  • Code of conduct
  • Privacy
  • Users
  • Instances
  • About Bonfire
devSJR :python: :rstats:
@devSJR@fosstodon.org  ·  activity timestamp 6 days ago

@LabPlot@floss.social
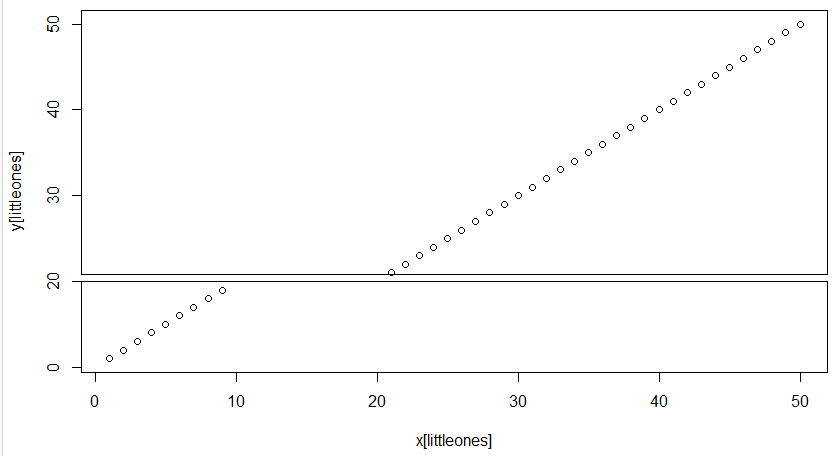
Hey Labplot, I'm asking for a friend. Can #Labplot do gap axises like #rstats #plotrix or #python #matplotlib?
@labplot@lemmy.kde.social @opensource

Scientific diagram showing a gap on the y-axis between two values. The plot is created using the plotrix package with the gap.plot function.
  • Copy link
  • Flag this post
  • Block
Log in

bonfire.cafe

A space for Bonfire maintainers and contributors to communicate

bonfire.cafe: About · Code of conduct · Privacy · Users · Instances
Bonfire social · 1.0.1-alpha.8 no JS en
Automatic federation enabled
  • Explore
  • About
  • Members
  • Code of Conduct
Home
Login