Discussion
Loading...

Post

  • About
  • Code of conduct
  • Privacy
  • Users
  • Instances
  • About Bonfire
Nicola Rennie
@nrennie@fosstodon.org  路  activity timestamp last week

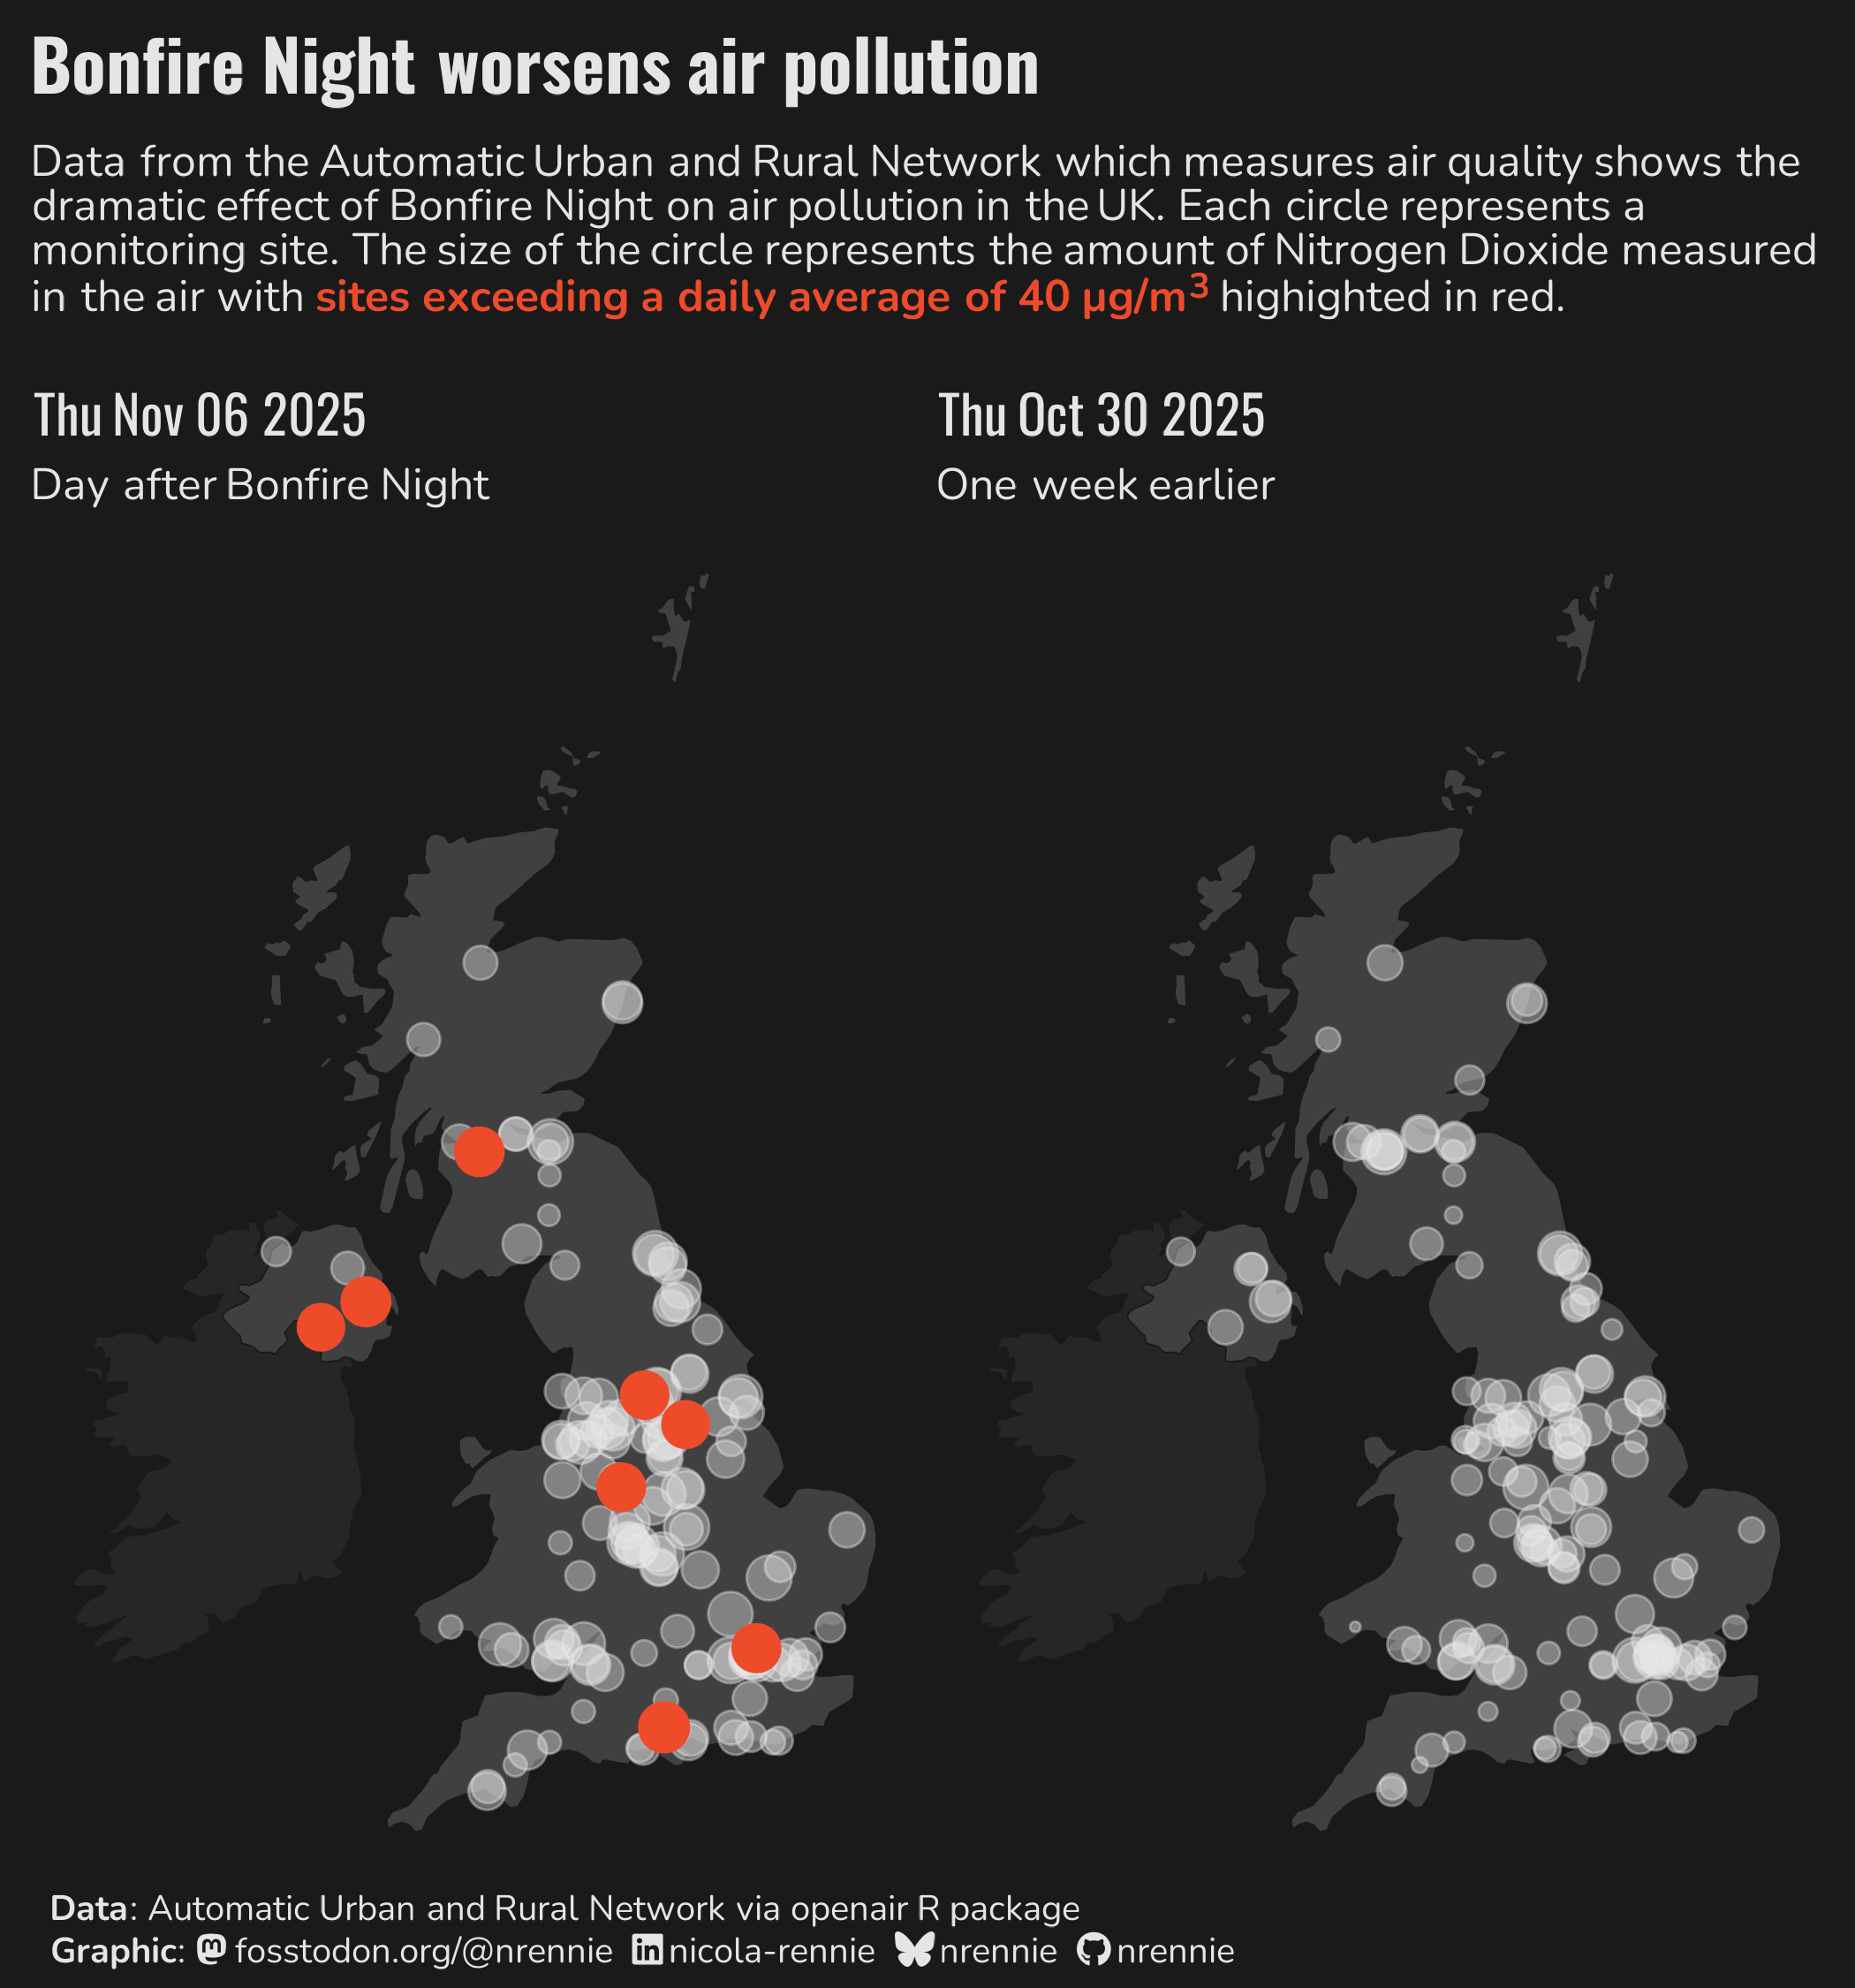
It's Day 10 of the #30DayMapChallenge and for the "air" prompt, I decided to look at air quality data before and after Bonfire Night in the UK 馃巼

#RStats #ggplot2 #DataViz

Side by side maps of the UK showing air quality before and after Bonfire night. The day after Bonfire night shows many more sites marked as exceeding a threshold of 40 micrograms/m3.
  • Copy link
  • Flag this post
  • Block
Log in

bonfire.cafe

A space for Bonfire maintainers and contributors to communicate

bonfire.cafe: About 路 Code of conduct 路 Privacy 路 Users 路 Instances
Bonfire social 路 1.0.0 no JS en
Automatic federation enabled
  • Explore
  • About
  • Members
  • Code of Conduct
Home
Login