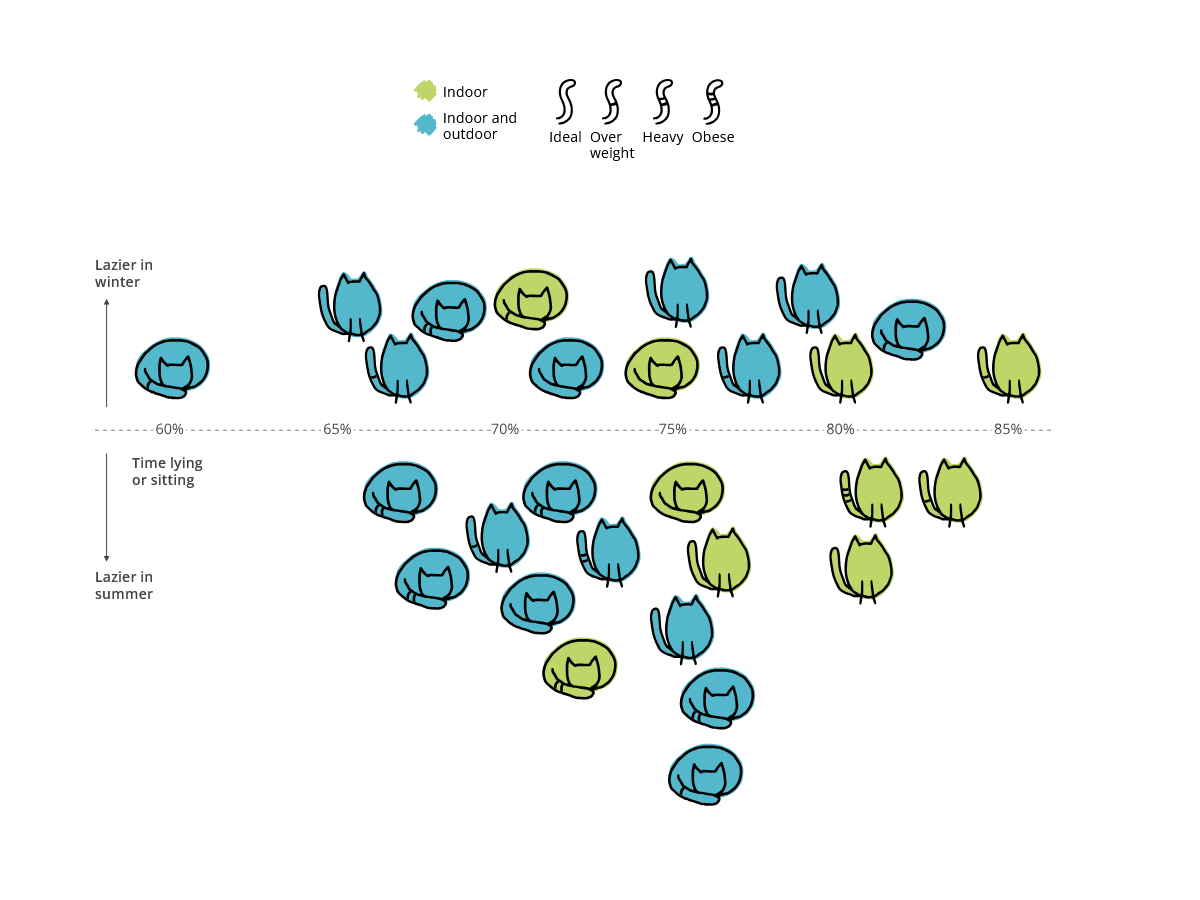
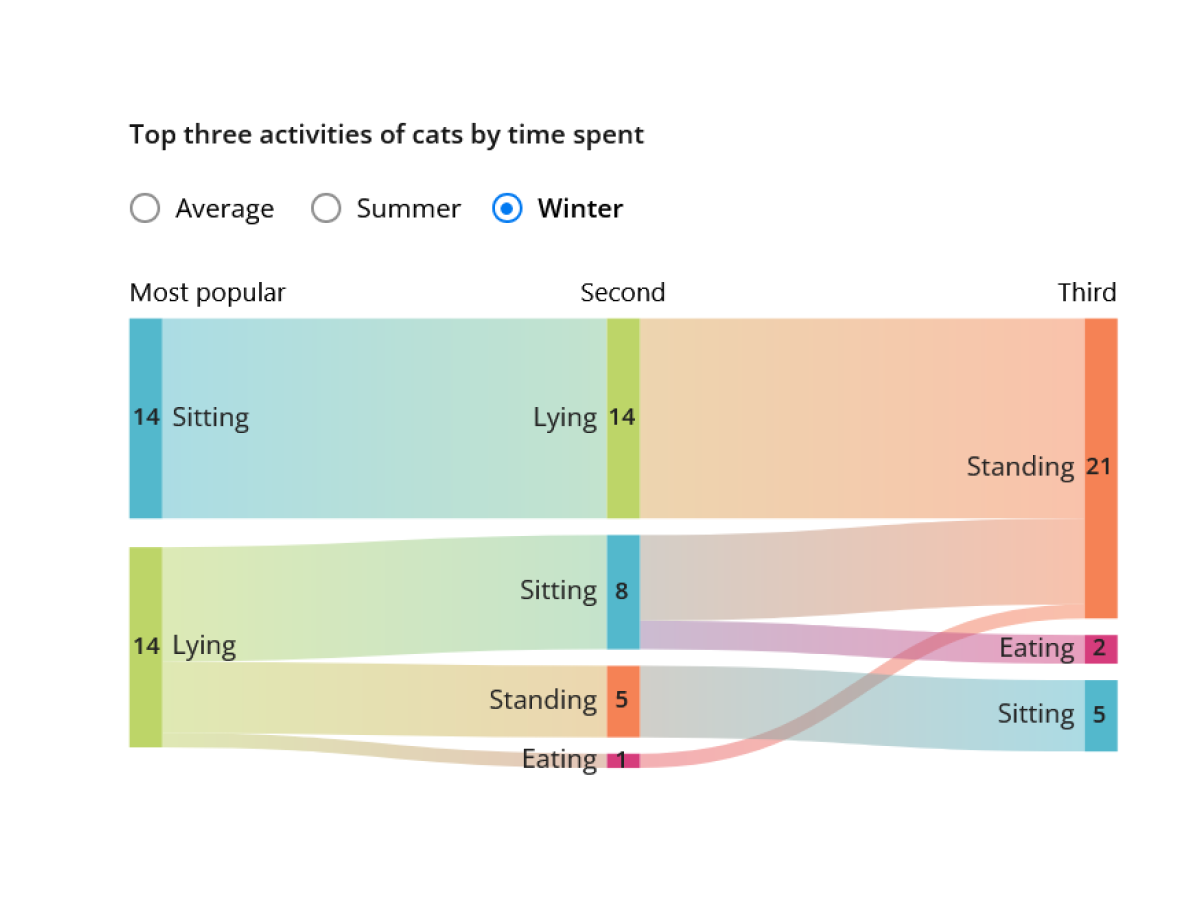
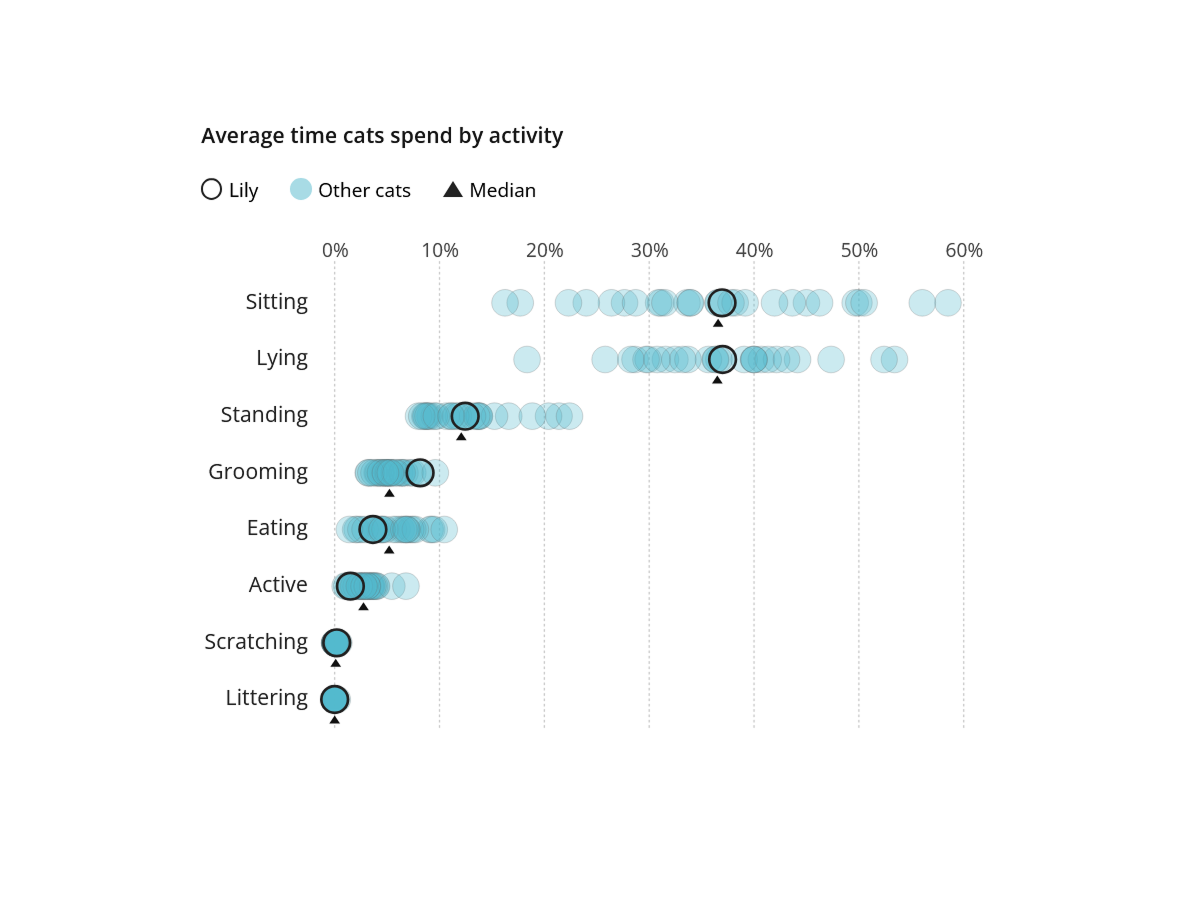
screenshot recording of the project page showing the header – Lazy Cats – and scrolling down the page. The page includes a range of charts (bar chart, dot plot, sankey, beeswarm) that the user can interact with to get more details in popups or show data for winter or summer seasons
Dot plot titled “Average time cats spend by activity,” comparing one cat named Lily to a group of other cats. The yaxis lists activities: Sitting, Lying, Standing, Grooming, Eating, Active, Scratching, and Littering. The xaxis shows percentage of time spent, from 0% to 60%. Each activity has three markers: light blue circles for individual other cats, a black triangle for the median value, and a blue-outlined circle for Lily. For example, Lily spends more time sitting than most cats, but less time grooming. The chart highlights how Lily’s behavior aligns or diverges from typical feline patterns
Sankey diagram showing the top three winter activities of cats ranked by time spent. The diagram has three columns labeled “Most popular,” “Second,” and “Third.” Each column lists activities such as sitting, lying, standing, and eating, with colored flows connecting them to show how rankings shift. For example, “Sitting” is the most popular activity for 14 cats; 8 others rank it second, and 5 rank it third. “Lying” is also most popular for 14 cats, the other 14 cats rank it second. “Standing” appears most often as a third-ranked activity. The chart highlights how feline preferences vary in winter, with sitting and lying dominating the top ranks and standing emerging as a frequent third choice
A beeswarm chart illustrating the relationship between cats’ activity levels, seasonal laziness, weight, categorized by indoor versus indoor/outdoor lifestyle. The xaxis shows the percentage of time spent lying or sitting (ranging from ~60% to 85%), while the yaxis represents whether cats are more lazy in winter or summer. Cat icons in sitting or lying positions indicate the specific cat’s most favourite pose. Green icons represent indoor cats; blue icons represent indoor/outdoor cats. The number of stripes in a cat’s tail indicate the weight (Ideal, Overweight, Heavy, or Obese). The chart suggests that indoor cats tend to be slightly less active.