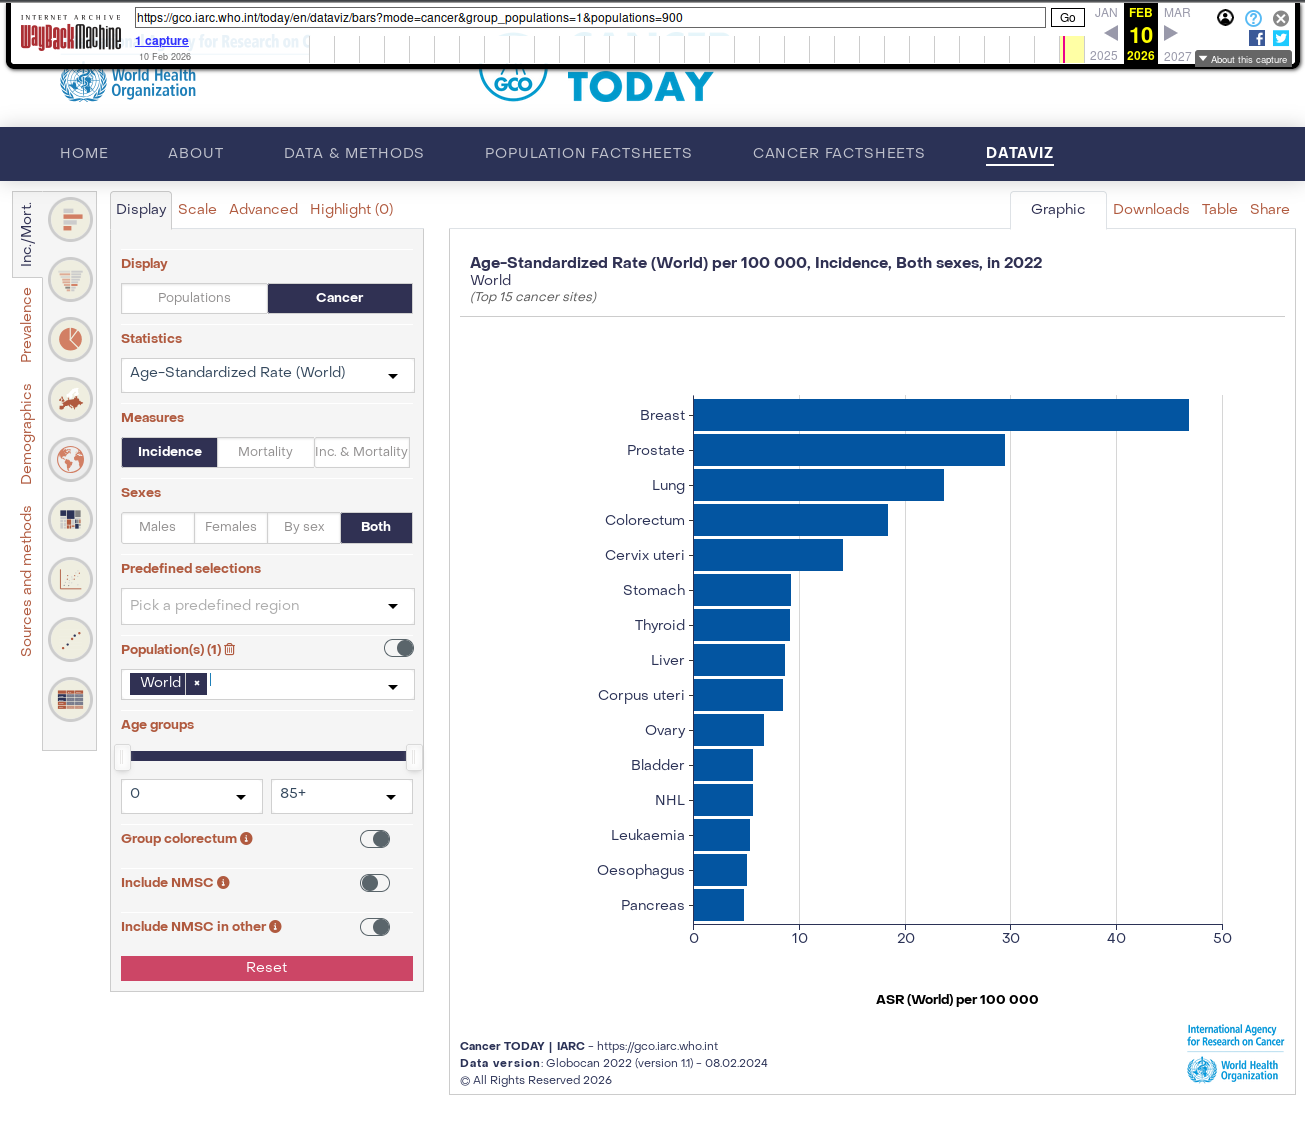
The screenshot from the WHO International Agency for Research on Cancer (IARC) data visualization tool, showing a bar chart titled "Age-Standardized Rate (World) per 100 000, Incidence, Both sexes, In 2022."
URL is from https://web.archive.org/. The chart displays the top 15 cancer sites by incidence rate worldwide for the year 2022.
Left side: Control panel with various options to customize the display (incl. selecting populations (e.g., World), statistics (Age-Standardized Rate), measures (Incidence), and sexes (Both)) and toggles for specific conditions like "Group colorectum".
Right side: Horizontal bar chart
- x-axis Age-Standardized Rate (ASR) per 100,000 people,
- y-axis lists different types of cancers, starting from Breast cancer at the top, followed by Prostate, Lung, Colorectum, Cervix uteri, Stomach, Thyroid, Liver, Corpus uteri, Ovary, Bladder, NHL (Non-Hodgkin Lymphoma), Leukaemia, Oesophagus, and Pancreas. The chart shows that Breast cancer has the highest incidence rate, followed by Prostate and Lung cancers.
Bottom of chart: Note mentioning "Cancer TODAY | IARC" with link https://gco.iarc.who.int.
Additional UI elements include navigation tabs at the top (e.g., HOME, ABOUT, DATAVIZ), and options for sharing or downloading the graphic on the right side of the image. The interface also includes date pickers and other controls for navigating or filtering data.