How cool something is vs. your age
by Matt Surelee @mattsurelee
How cool something is vs. your age
by Matt Surelee @mattsurelee
@infobeautiful
I didn't find the color for skateboarding on the diagram. Is it represented by the half pipe grafik? 🤔
@infobeautiful the alt is missing a lot of information (has it been generated by an AI ?), I'd update it that way :
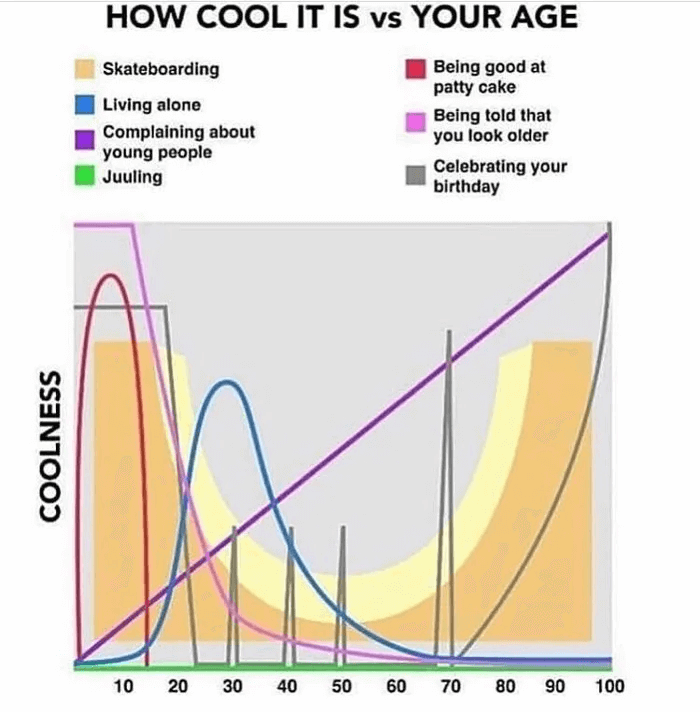
Infographic titled 'HOW COOL IT IS vs YOUR AGE', with a horizontal axis going from 0 to 100 (the age) and an unlabeled coolness vertical axis with no scale.
Skateboarding is represented by a skating half pipe : very cool until 20 years old, it drops significantly until 50, then rises again to be very cool at 80.
Living alone is very uncool at a young age, very cool from 20 to mid-thirties, then drops again until it reaches 0 after 60.
Complaining about young people is a straight ascending 45° line : very uncool at a young age, very cool at 100.
Juuling is a straight horizontal line at the bottom of the chart : it is never cool.
Being good at patty cake is very cool until 10 then drops abruptly.
Being told that you look older is very cool from 0 to 15, then drops quickly.
Celebrating your birthday is very cool until 20, then drops to 0. It is cool again at 30, 40, and 50, very cool at 69, then the coolness rises exponentially the more we're close to 100.
@infobeautiful ooh, that's a nice one :)
but your alt-text-generating "AI" is NOT capable of reading diagrams 🙄
(still thanks for adding alt though)
@infobeautiful ...Do one on "how cool" it is VS Nerdiness. Cool graph. LOL 🤓
@infobeautiful Juuling?
NADDG, oh vaping.
@infobeautiful
Wait, why isn't it cool to celebrate your 60th birthday though?