Discussion
Loading...

Post

Log in
  • About
  • Code of conduct
  • Privacy
  • Users
  • Instances
  • About Bonfire
Brian Marick
Brian Marick
@marick@mstdn.social  ·  activity timestamp 2 weeks ago

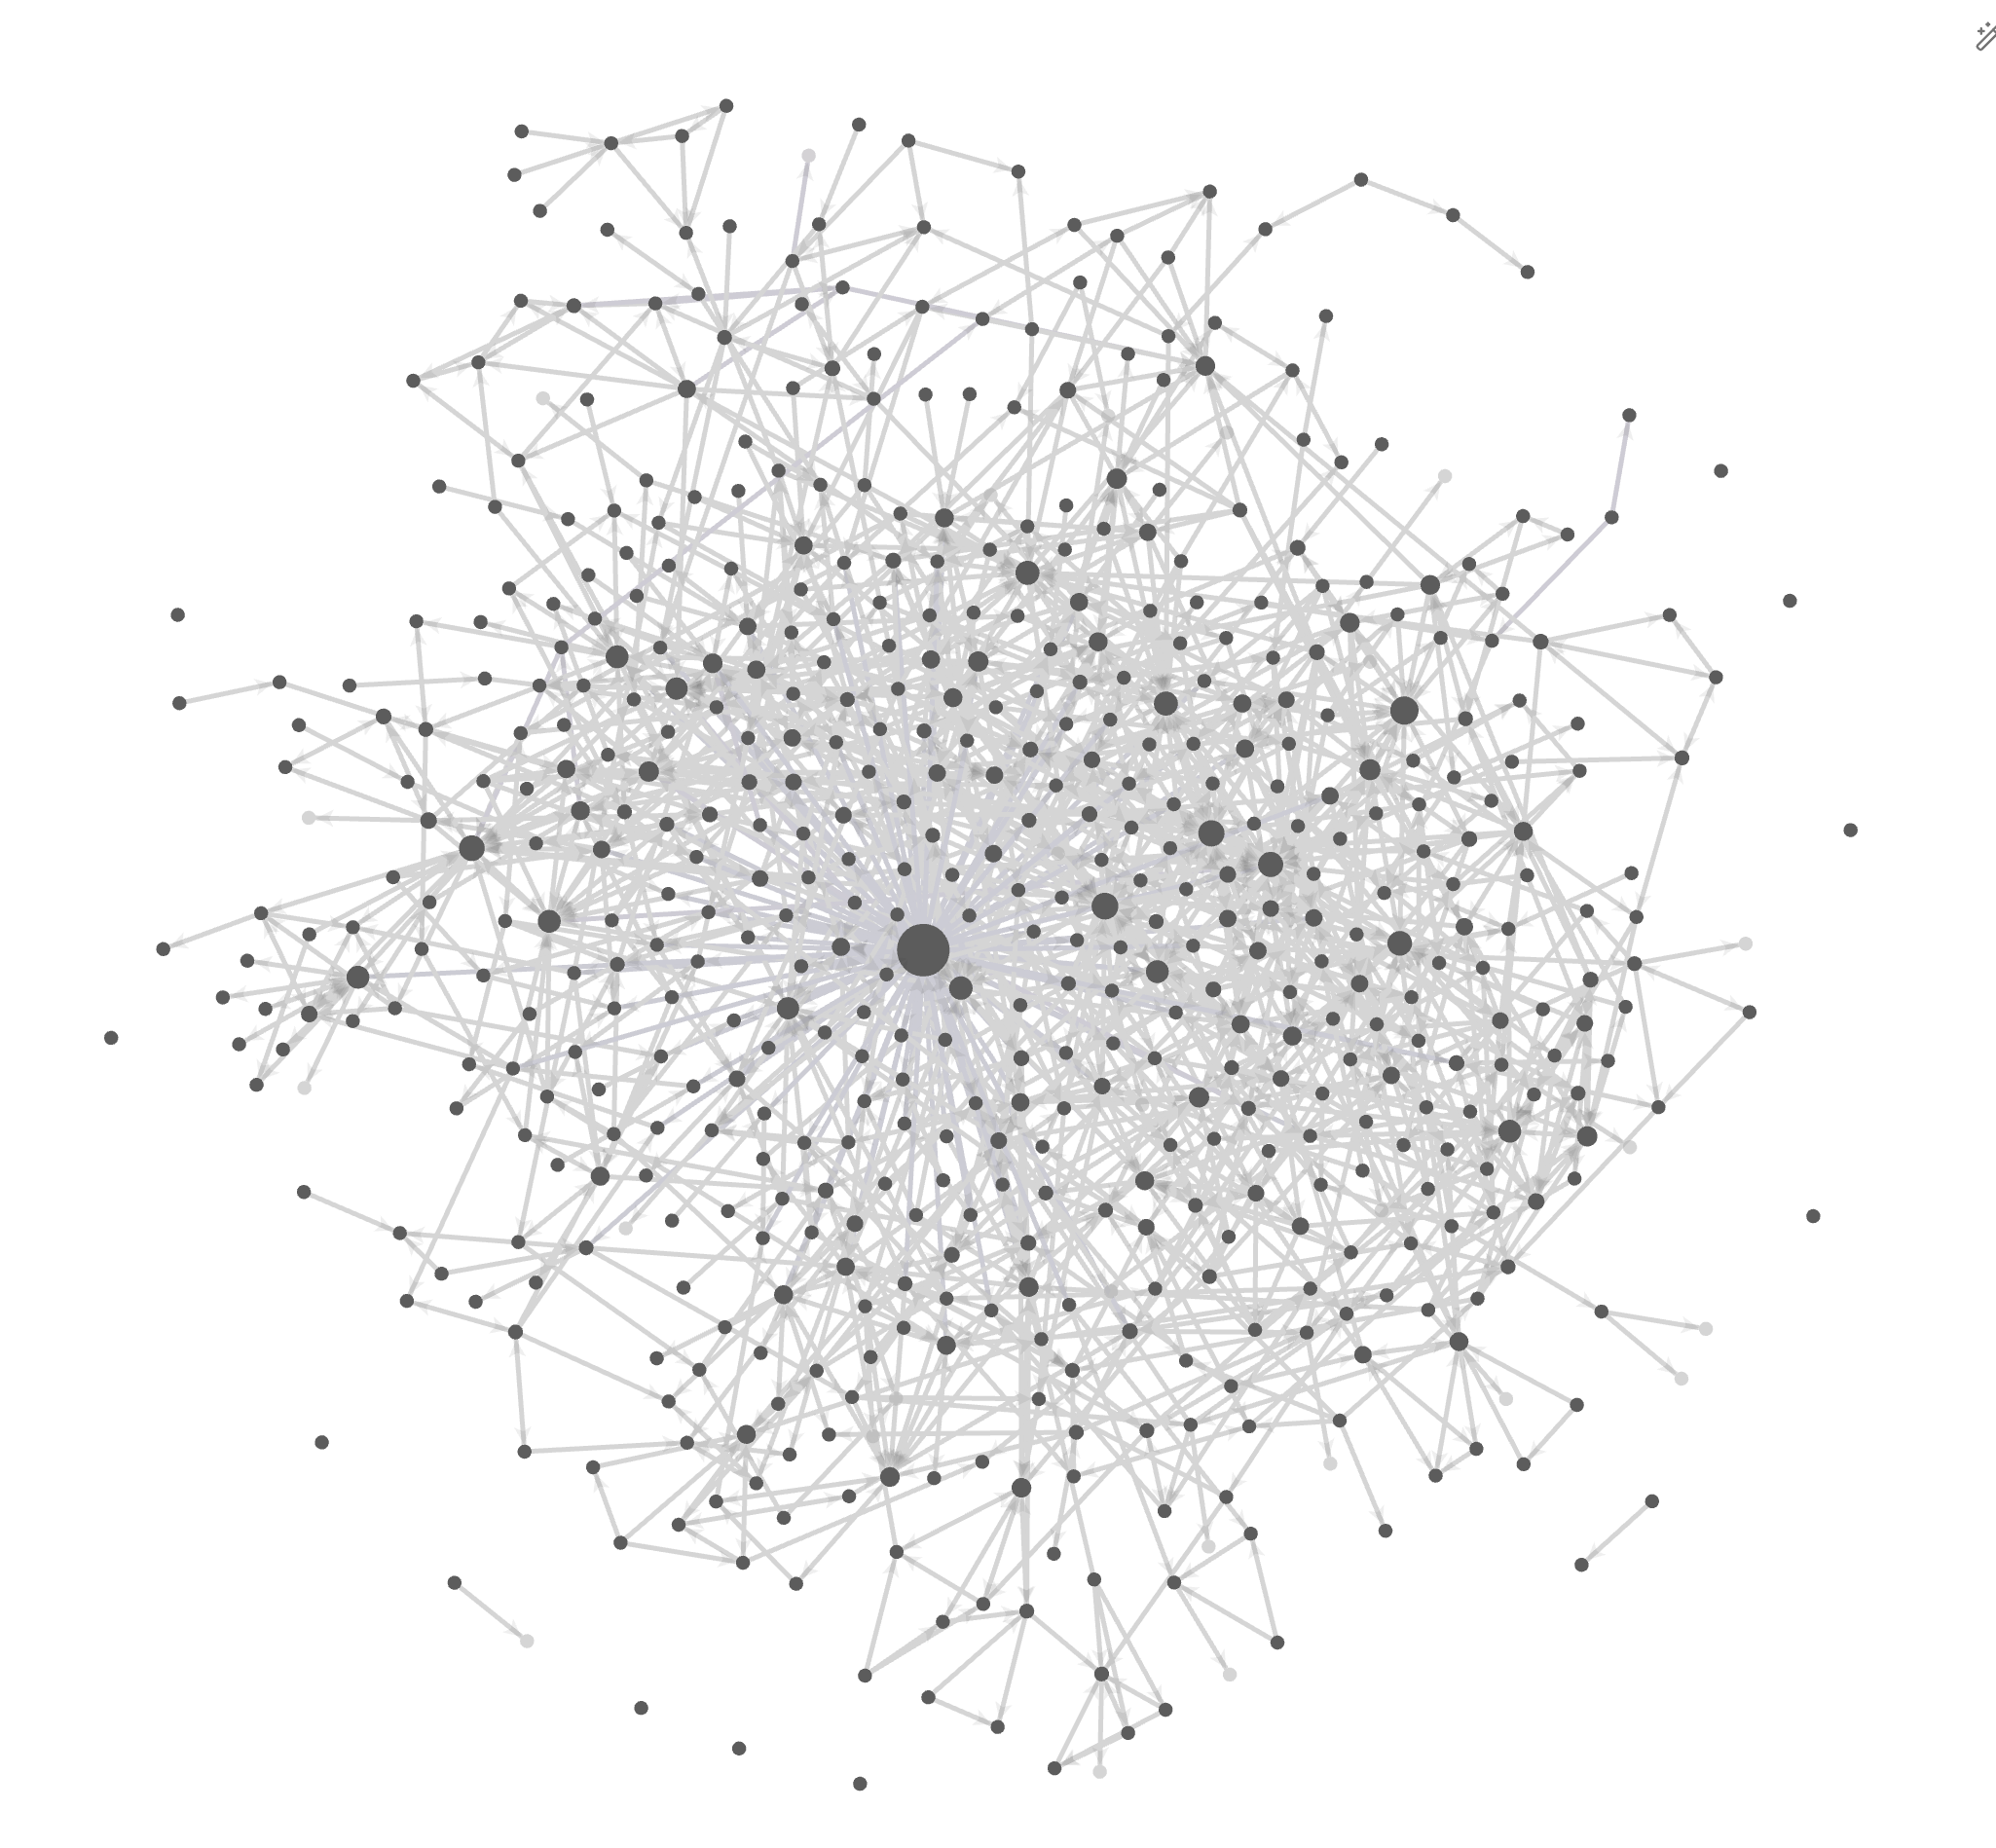
So here’s a connection graph of my #Zettelkasten notes. I’m very much not a visual person, so I don’t know how to get insight from node-and-link graphs.

Does anyone have pointers to sources on how to infer useful things from a visual representation of a knowledge graph?

It’s a big blob of dots, mostly all the same size but with one big one, connected with dots. There is no obvious structure. (For example, there’s only one node that has a lot of links, a table-of-contents node.)
  • Copy link
  • Flag this post
  • Block

bonfire.cafe

A space for Bonfire maintainers and contributors to communicate

bonfire.cafe: About · Code of conduct · Privacy · Users · Instances
Bonfire social · 1.0.1-alpha.40 no JS en
Automatic federation enabled
Log in
  • Explore
  • About
  • Members
  • Code of Conduct