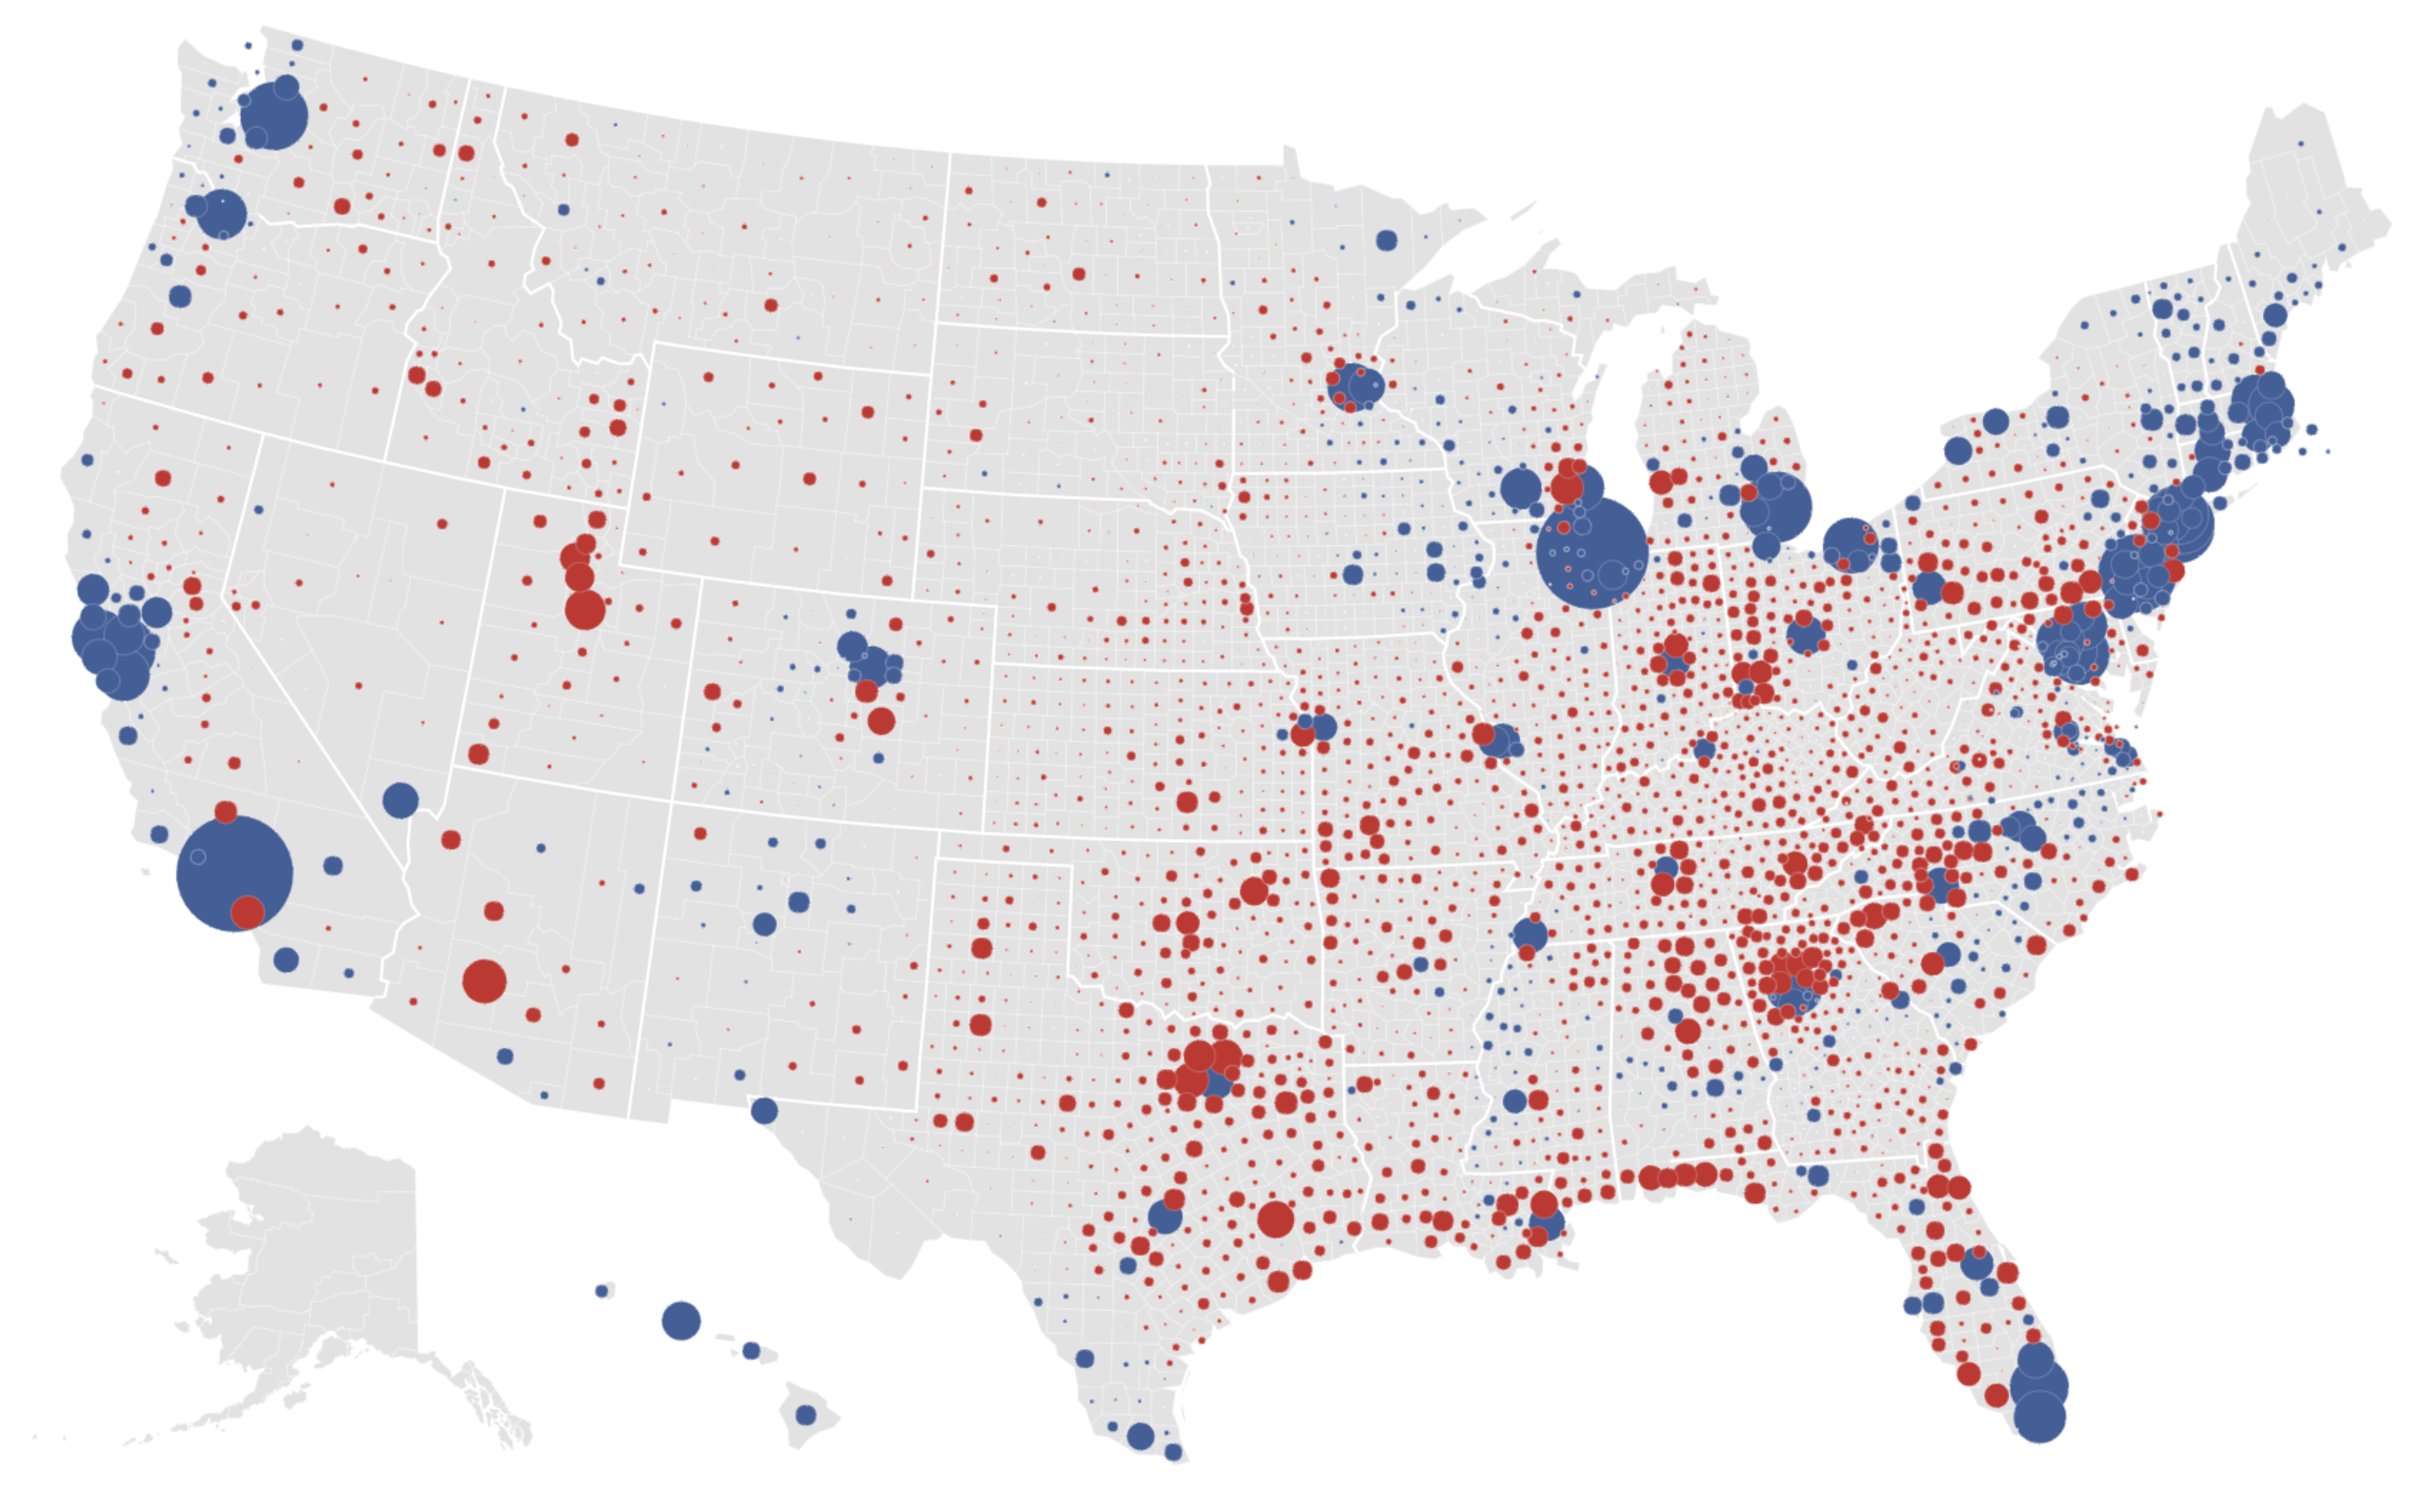
I saw one of those maps that shows how people in different regions voted with red being Republican and blue being Democrat and the majority was sadly red, but someone commented by saying that the blue area is where most people live and the red area is where cows shit and it was 100% accurate.
Discussion
Loading...


@Alice
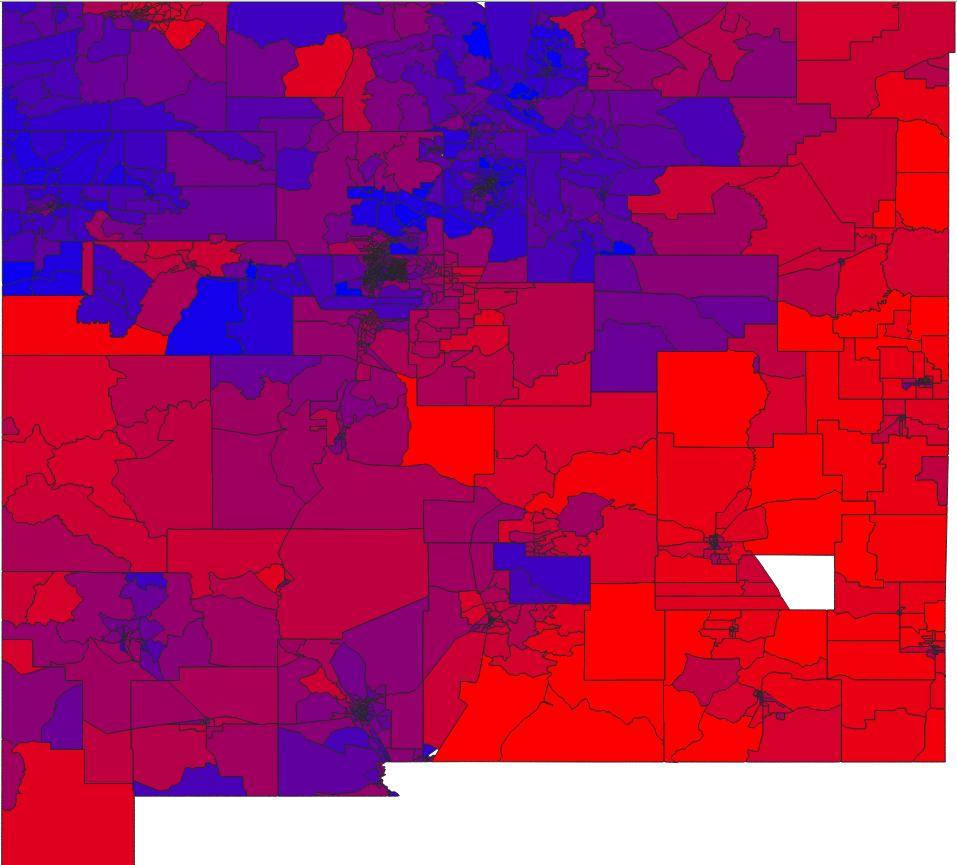
Behold New Mexico!
Lots of rural precincts in the Land of Enchantment are blue. (Except for the southeast sector at the lower right, which is often called "Little Texas" for good(?) reason.)
Those rural blue regions largely correspond to:
https://www.sos.nm.gov/voting-and-elections/native-american-election-information-program/23-nm-federally-recognized-tribes-in-nm-counties/
And we have another entity that only exists along the borderlands:
https://en.wikipedia.org/wiki/Colonia_(United_States) Colonias tend to vote blue, and are considered rural precincts.
https://www.nmfinance.com/colonias/
melioristicmarie@tech.lgbt
lffontenelle@mastodon.social
JessTheUnstill@infosec.exchange
SymTrkl@anarres.family
joelle@social.joelle.us
pattykimura@beige.party
https://universeodon.com/@lucybeahere@mstdn.social
JackPine@ohai.social
albnelson@beige.party
benroyce@mastodon.social
tankgrrl@hachyderm.io
jhavok@mstdn.party
kimlockhartga@beige.party


@Alice The USA doesn’t have a proper democracy, the ‘colleges’ will always skew any election to the right. Mind you, the U.K. is no better, but for different reasons.


@Alice In other words, the blue areas pay the taxes, the red areas are were the tax cuts are subsidized.


@Alice The Electoral College was created so the owners of people would get extra votes. All that has happened now is it has moved on to non-human livestock.


@Alice
Any time you view a map, look for the spatial, temporal and density contexts of the statistics being displayed.
Any time you view a map, look for the spatial, temporal and density contexts of the statistics being displayed.
This even goes for just regular maps. The state of Kansas appears flat, unless you use a 1 cm contour line...most are 20' or 40' in flat areas and 100' in mountainous. That is an example of the density of statistics. Number of meadow muffins per acre is another...😉
As Mark Twain said "Facts are stubborn, but statistics are more pliable," holds true for maps.🤔


@Alice Yup, here's one of them for example.
What makes a red state vs a blue state is largely down to the ratio of urban vs rural voters, and then which way their suburbs swing.