Discussion
Loading...

Post

  • About
  • Code of conduct
  • Privacy
  • Users
  • Instances
  • About Bonfire
Luca Hammer
@luca@social.luca.run  ·  activity timestamp 6 months ago

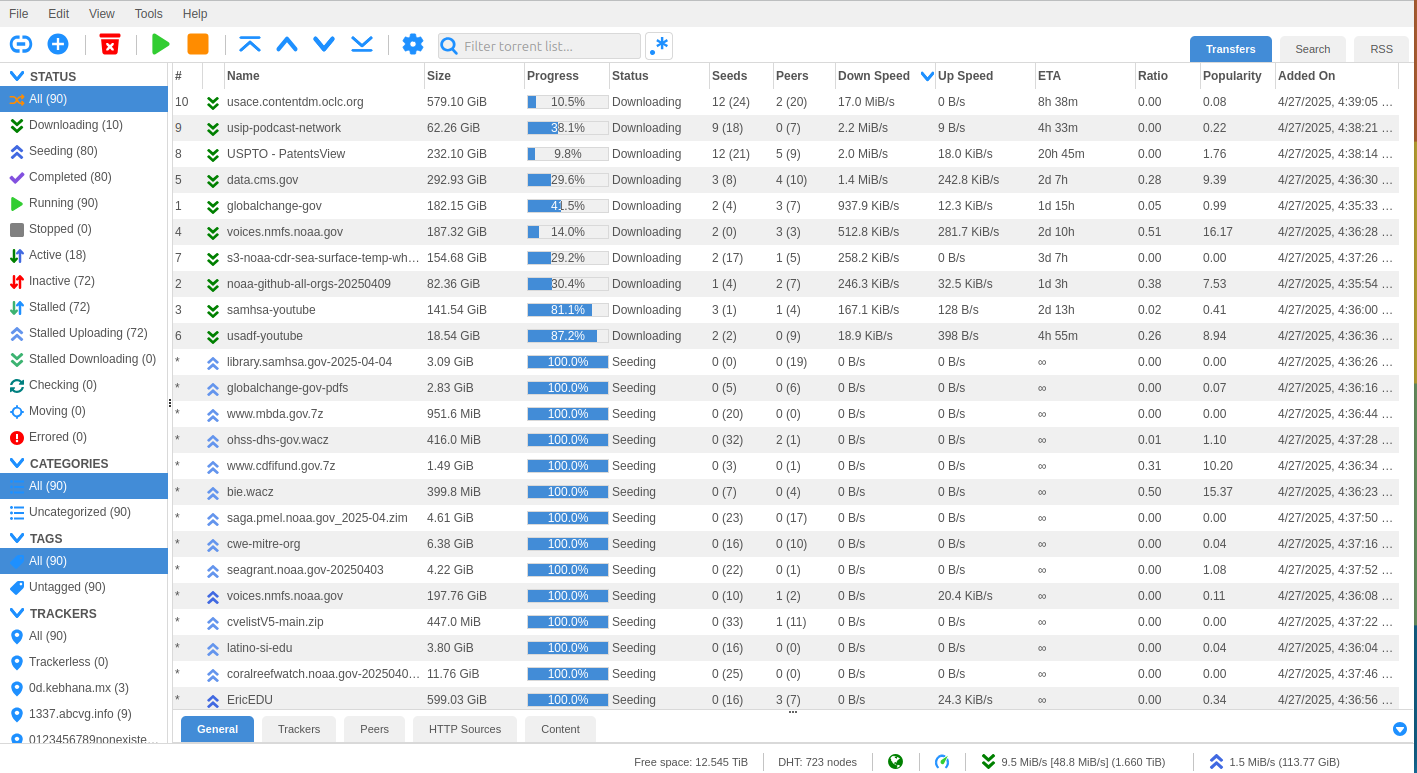
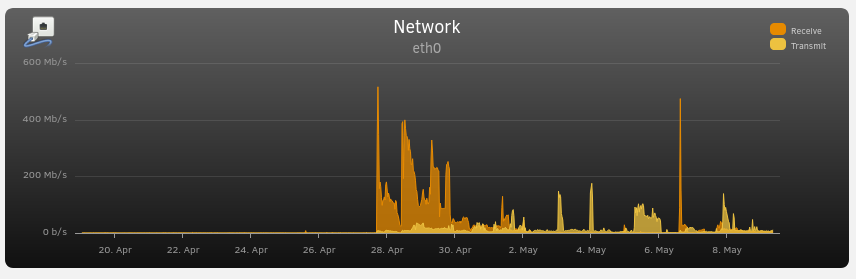
I joined the #safeguardingresearch #sciop torrent swarm to keep datasets from USA science institutions easily available.

Setup a qbittorrent Docker https://docs.linuxserver.io/images/docker-qbittorrent/
Added dataset feeds by threat level (I went with extinct, takedown_issued and endangered) https://sciop.net/feeds
Done

Screenshot of qbittorrent web interface showing 90 torrents that are currently downloading or seeding. Free space 12.5 TB, 9.5 MBit/s download speed, 1.6 TB total, 1.5 MBit/s upload speed, 115 GB total.
  • Copy link
  • Flag this post
  • Block
Luca Hammer
@luca@social.luca.run replied  ·  activity timestamp 6 months ago

My connection isn't saturated yet, but #sciop uses significant portions of it. Good.

Graph shows combined usage for all 33 containers and 2 VMs on that server.

Area chart showing received and transmitted data over time for eth0. y-axis foes from 0 b/s to 600 Mb/s. Shortly before April 28th the download shoots up to over 400 Mb/s and stays high for several days. Before that up- and download are nearly invisible on the chart. Upload gets higher slowly and has several hours since then where it comes close to 200 Mb/s.
  • Copy link
  • Flag this comment
  • Block
Log in

bonfire.cafe

A space for Bonfire maintainers and contributors to communicate

bonfire.cafe: About · Code of conduct · Privacy · Users · Instances
Bonfire social · 1.0.0-rc.3.21 no JS en
Automatic federation enabled
  • Explore
  • About
  • Members
  • Code of Conduct
Home
Login