Discussion
Loading...

#Tag

Log in
  • About
  • Code of conduct
  • Privacy
  • Users
  • Instances
  • About Bonfire
Fabrizio Musacchio
Fabrizio Musacchio
@FabMusacchio@mastodon.social  ·  activity timestamp yesterday

Syeda, …, @computingnature et al., bioRxiv (2026) find that #NeuralActivity in #mouse #VisualCortex is dominated by #orofacial movements, not eye movements. Across darkness and visual stimulation, eye movements explain only a small fraction of neural variance and are largely correlated with whisking and sniffing. Movement signals thus strongly shape #V1 activity during free viewing.

📄 https://doi.org/10.64898/2026.02.04.703800

#Neuroscience

Diagram showing face view and eye tracking data, including keypoints, eye movement, and gaze direction analysis.
  • Copy link
  • Flag this post
  • Block
Fabrizio Musacchio
Fabrizio Musacchio
@pixeltracker@sigmoid.social  ·  activity timestamp 2 months ago

🧠 New preprint by Tilbury et al: Characterizing #NeuronalPopulation geometry with #AI equation discovery

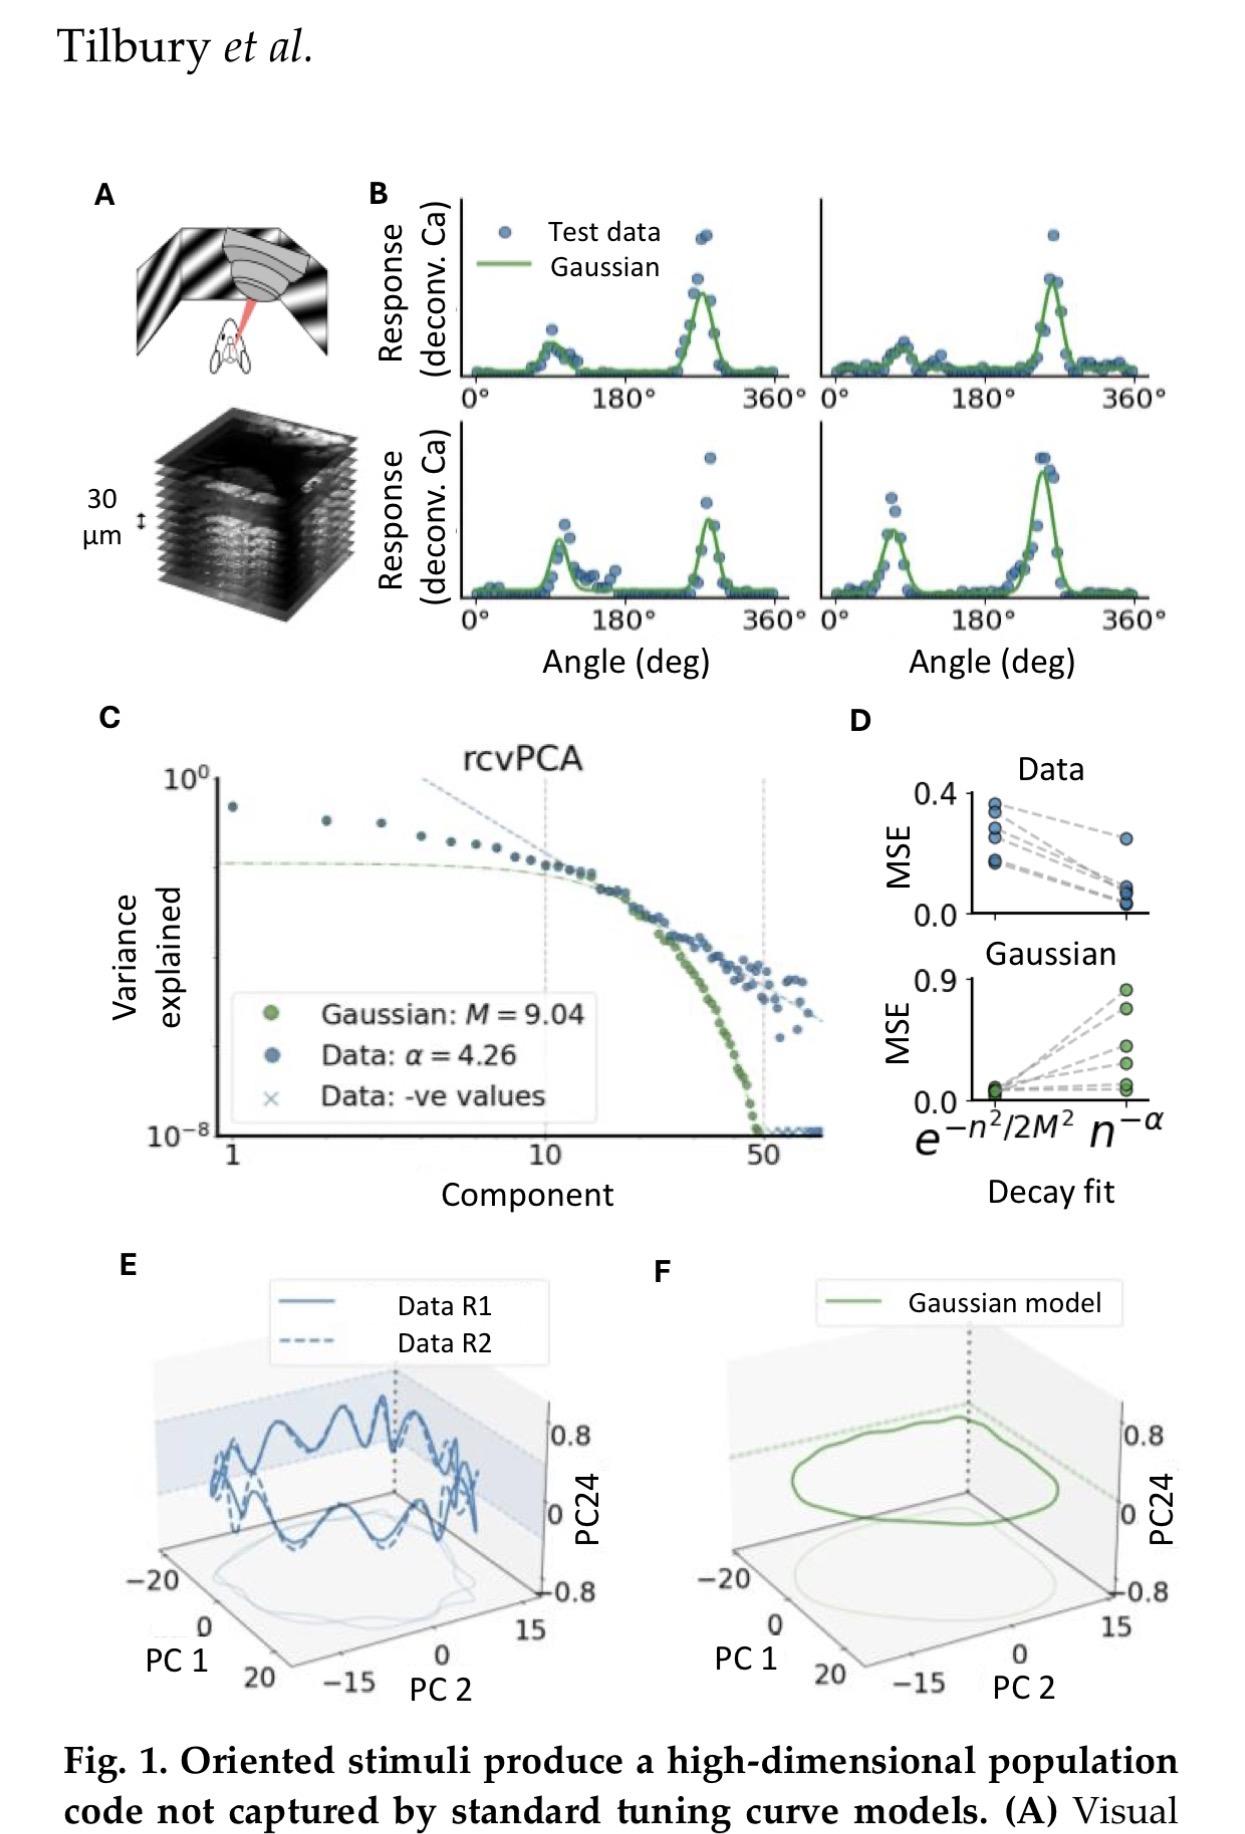
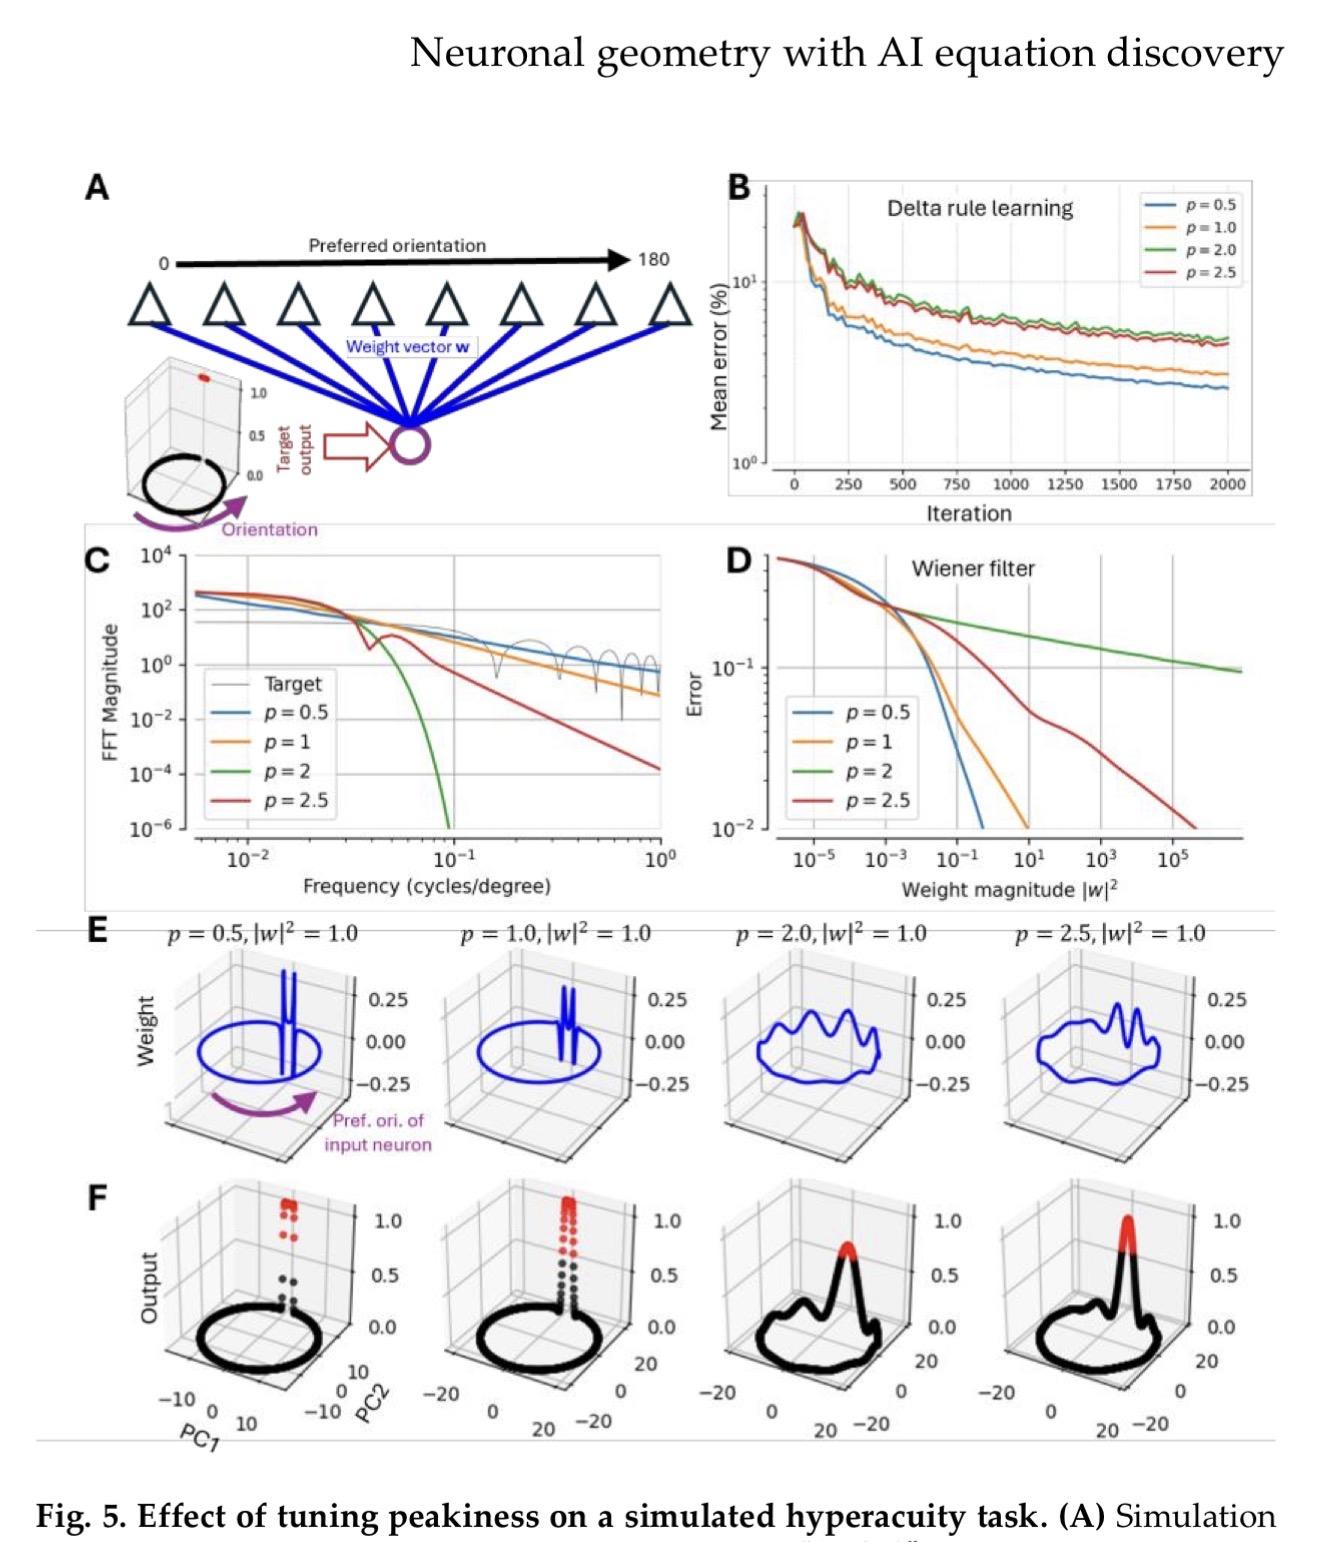
The approach generates & evaluates 100s of candidate equations, finding "peaky" non-Gaussian tuning functions whose Fourier structure matches power-law dimensionality observed in real #V1 pops. Links shape of single- #neuron tuning to #PopulationLevel geometry using both data fits & analytical derivations.

🌍 https://doi.org/10.1101/2025.11.12.688086

#CompNeuro #Neuroscience #NeuralCoding #PopulationDynamics

2 media
Fig. 1. Oriented stimuli produce a high-dimensional population code not captured by standard tuning curve models.
Fig. 5. Effect of tuning peakiness on a simulated hyperacuity task.

Characterizing neuronal population geometry with AI equation discovery

  • Copy link
  • Flag this post
  • Block

bonfire.cafe

A space for Bonfire maintainers and contributors to communicate

bonfire.cafe: About · Code of conduct · Privacy · Users · Instances
Bonfire social · 1.0.2-alpha.22 no JS en
Automatic federation enabled
Log in
  • Explore
  • About
  • Members
  • Code of Conduct