Experimenting with colors ...
#Archeology #Radiocarbon #Python #OpenScience #Matplotlib #ClimateScience #Prehistory
#Tag
Experimenting with colors ...
#Archeology #Radiocarbon #Python #OpenScience #Matplotlib #ClimateScience #Prehistory
IOSACal 0.7
IOSACal 0.7 was released yesterday. Here is a quick summary of what’s new.
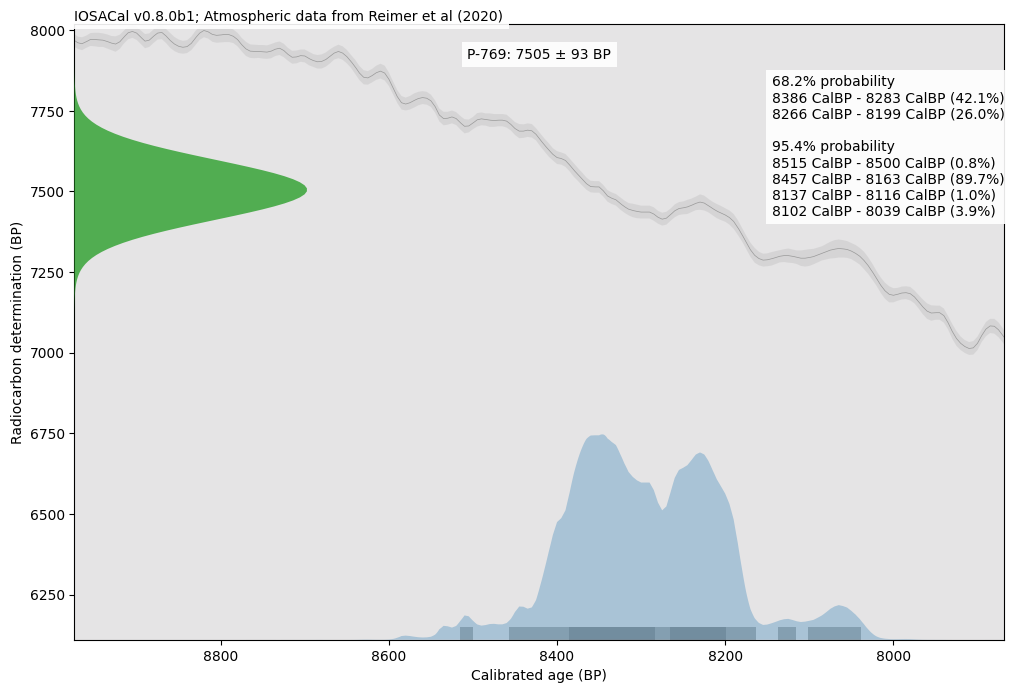
One of the standard plots rendered in the latest IOSACal version. It looks exactly as before.
This long cycle was mostly about documentation improvements and some maintenance tasks, the boring but essential work that keeps the project going.
Version 0.7 is already available in PyPI and conda-forge. There is an updated version record at Zenodo.
All changes were contributed by Stefano Costa.
Documentation […]
IOSACal 0.7
IOSACal 0.7 was released yesterday. Here is a quick summary of what’s new.
One of the standard plots rendered in the latest IOSACal version. It looks exactly as before.
This long cycle was mostly about documentation improvements and some maintenance tasks, the boring but essential work that keeps the project going.
Version 0.7 is already available in PyPI and conda-forge. There is an updated version record at Zenodo.
All changes were contributed by Stefano Costa.
Documentation […]
Ancient oysters provide far-field sea-level constraints on ice melt timing and sources during the early–mid Holocene climate transition