4/5 As an extreme example, you can plot the analemmas for noon and see that it's below the horizon for part of the year in the arctics: this is when those latitudes are in the long polar night! (the crazy looping around latitude = 0 is just from a singularity due to the spherical-to-rect projection)
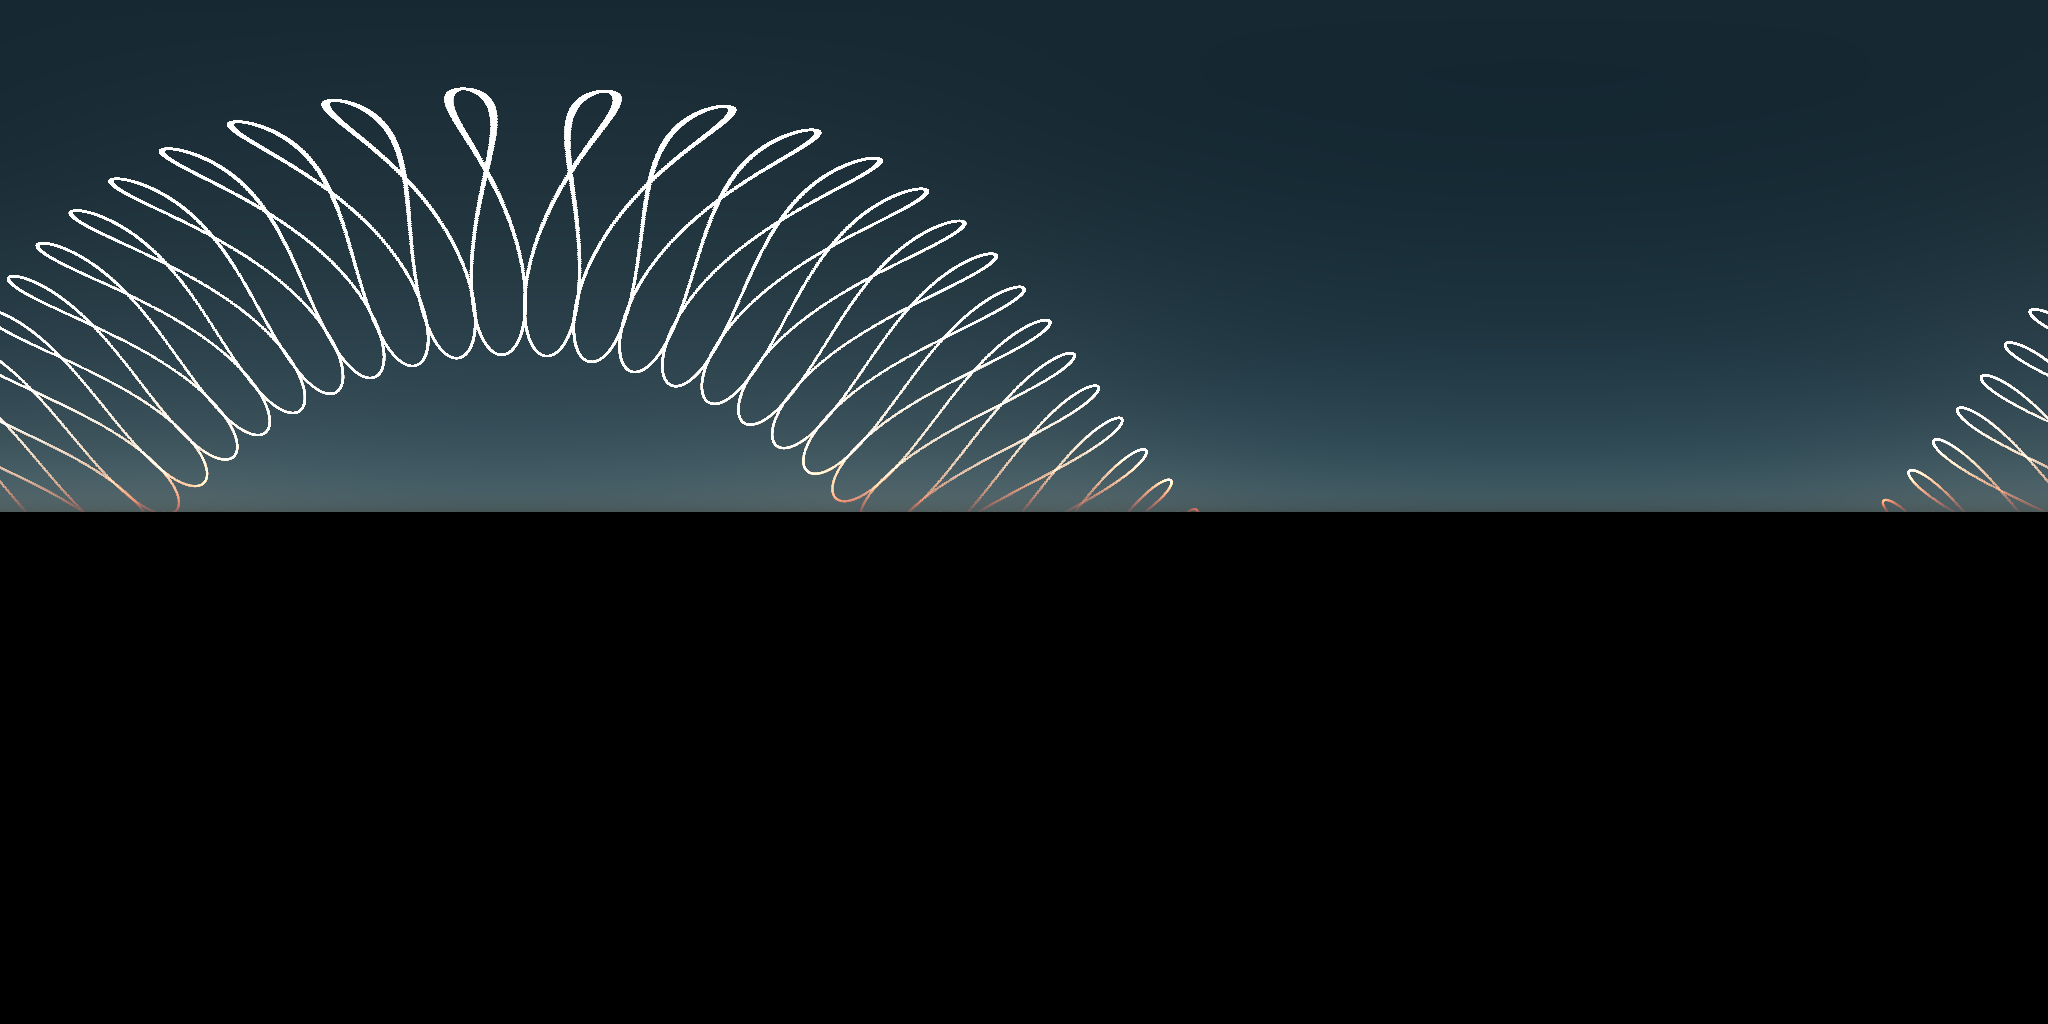
figure 8 rising and falling below horizon

5/5 Focusing back on a single lat/long, here we simulate the analemma across the day in DC (here, in 30 minute increments) to see how the shape changes position across the sky/year. Basically, visualizing a 2D projected slice of 4D time/space: that's a fun #dataviz!

#RStats #rayverse

1/5 Modeling the atmosphere at noon in Washington, DC for a full year in #RStats with the #rayverse and my upcoming sky modeling package. If you follow the path of the sun, you might notice that it travels in a lopsided figure eight curve. Why? What's going on here?

sky simulation animation showing figure 8 pattern