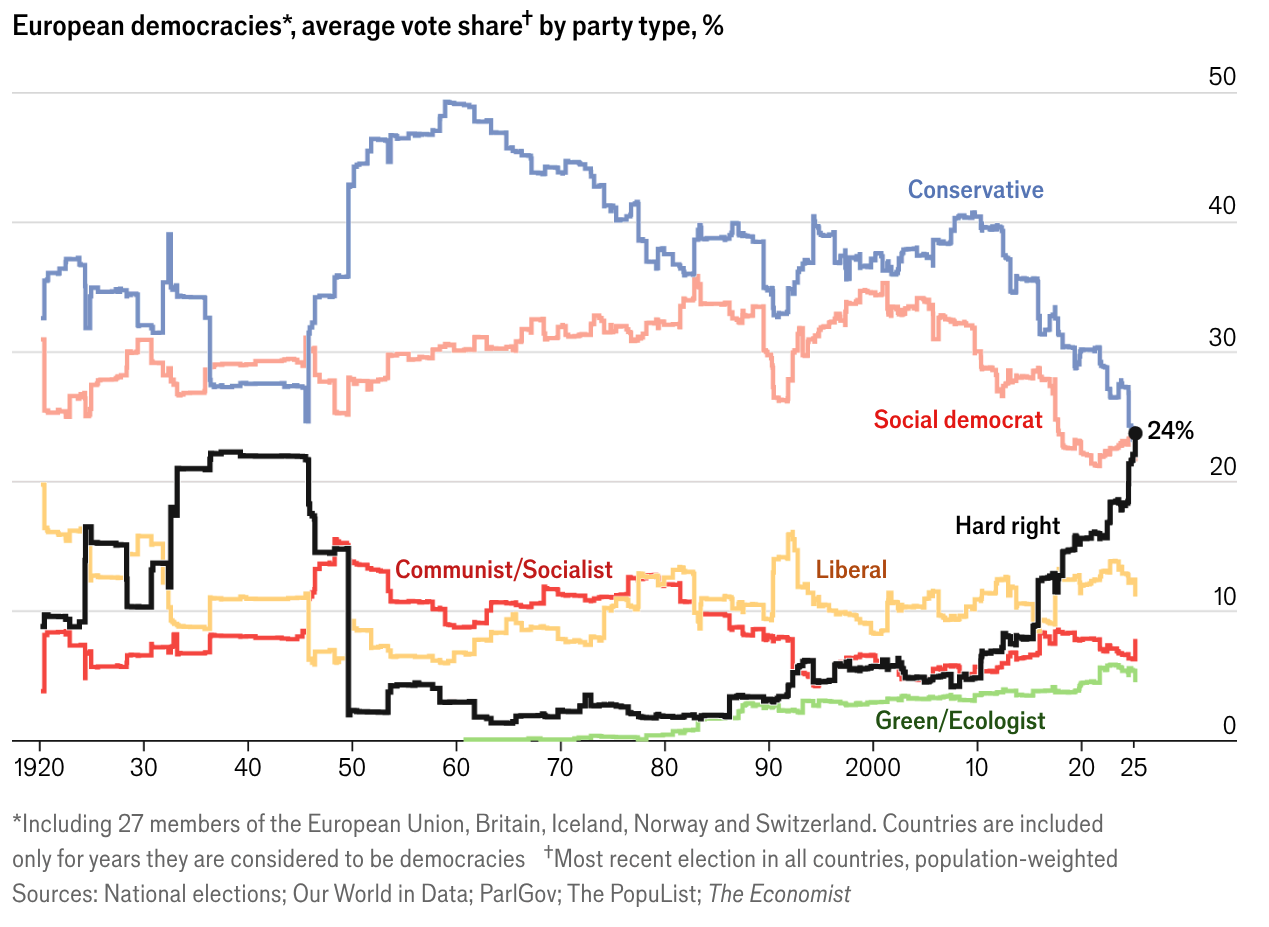
Line chart titled "European democracies, average vote share by party type, percent," tracking six party families from 1920 to 2025.
The Conservative line (blue) starts around 35 percent in 1920, surges to a peak near 48 percent in the early 1960s, then declines steadily, ending around 24 percent in 2025. The Social democrat line (salmon/pink) begins near 25 percent, rises gradually to roughly 32 percent through the 1960s–1990s, then falls sharply after 2010 to about 18 percent. The Hard right line (black) is volatile early, spiking to nearly 22 percent in the late 1930s and early 1940s, collapsing to near zero around 1950, staying low for decades, then climbing steeply from the 1990s onward to reach 24 percent in 2025—labeled with a black dot. The Communist/Socialist line (red) sits mostly between 5 and 15 percent, peaking just after 1950 and ending around 7 percent. The Liberal line (yellow) hovers between 5 and 15 percent throughout, ending near 10 percent. The Green/Ecologist line (light green) is near zero until the 1980s, then rises gradually to about 6 percent by 2025.
The vertical axis runs 0 to 50 percent; the horizontal axis spans 1920 to 2025.
Footnote: Including 27 members of the EU, Britain, Iceland, Norway and Switzerland; countries are included only for years they are considered democracies. Figures reflect the most recent election in all countries, population-weighted. Sources: National elections; Our World in Data; ParlGov; The PopuList; The Economist.