oh I found my problem
I forgot what I named the data and tried to call it by a different name
*looks directly at the camera*
I've given a lot of talks this week
Post
oh I found my problem
I forgot what I named the data and tried to call it by a different name
*looks directly at the camera*
I've given a lot of talks this week
hang on I need to go leave a github star on the vapoRwave repo now that I KNOW ABOUT GITHUB STARSSSSS
So uh, mental health familiarity by country.......what's going on*
*I know what's going on. Really big culture*gender differences on this probably (don't forget this is a 92% male sample)
somehow we're mucking around with fonts now because that's important to The Aesthetic
R, standing in the middle of the room inside of the vaporwear I've dressed her in, looking the way my dog looks when we give him a bath, staring into the middle distance
OH MY GOD WE'RE LANDING SOON????????? BUT MY GRAPHS
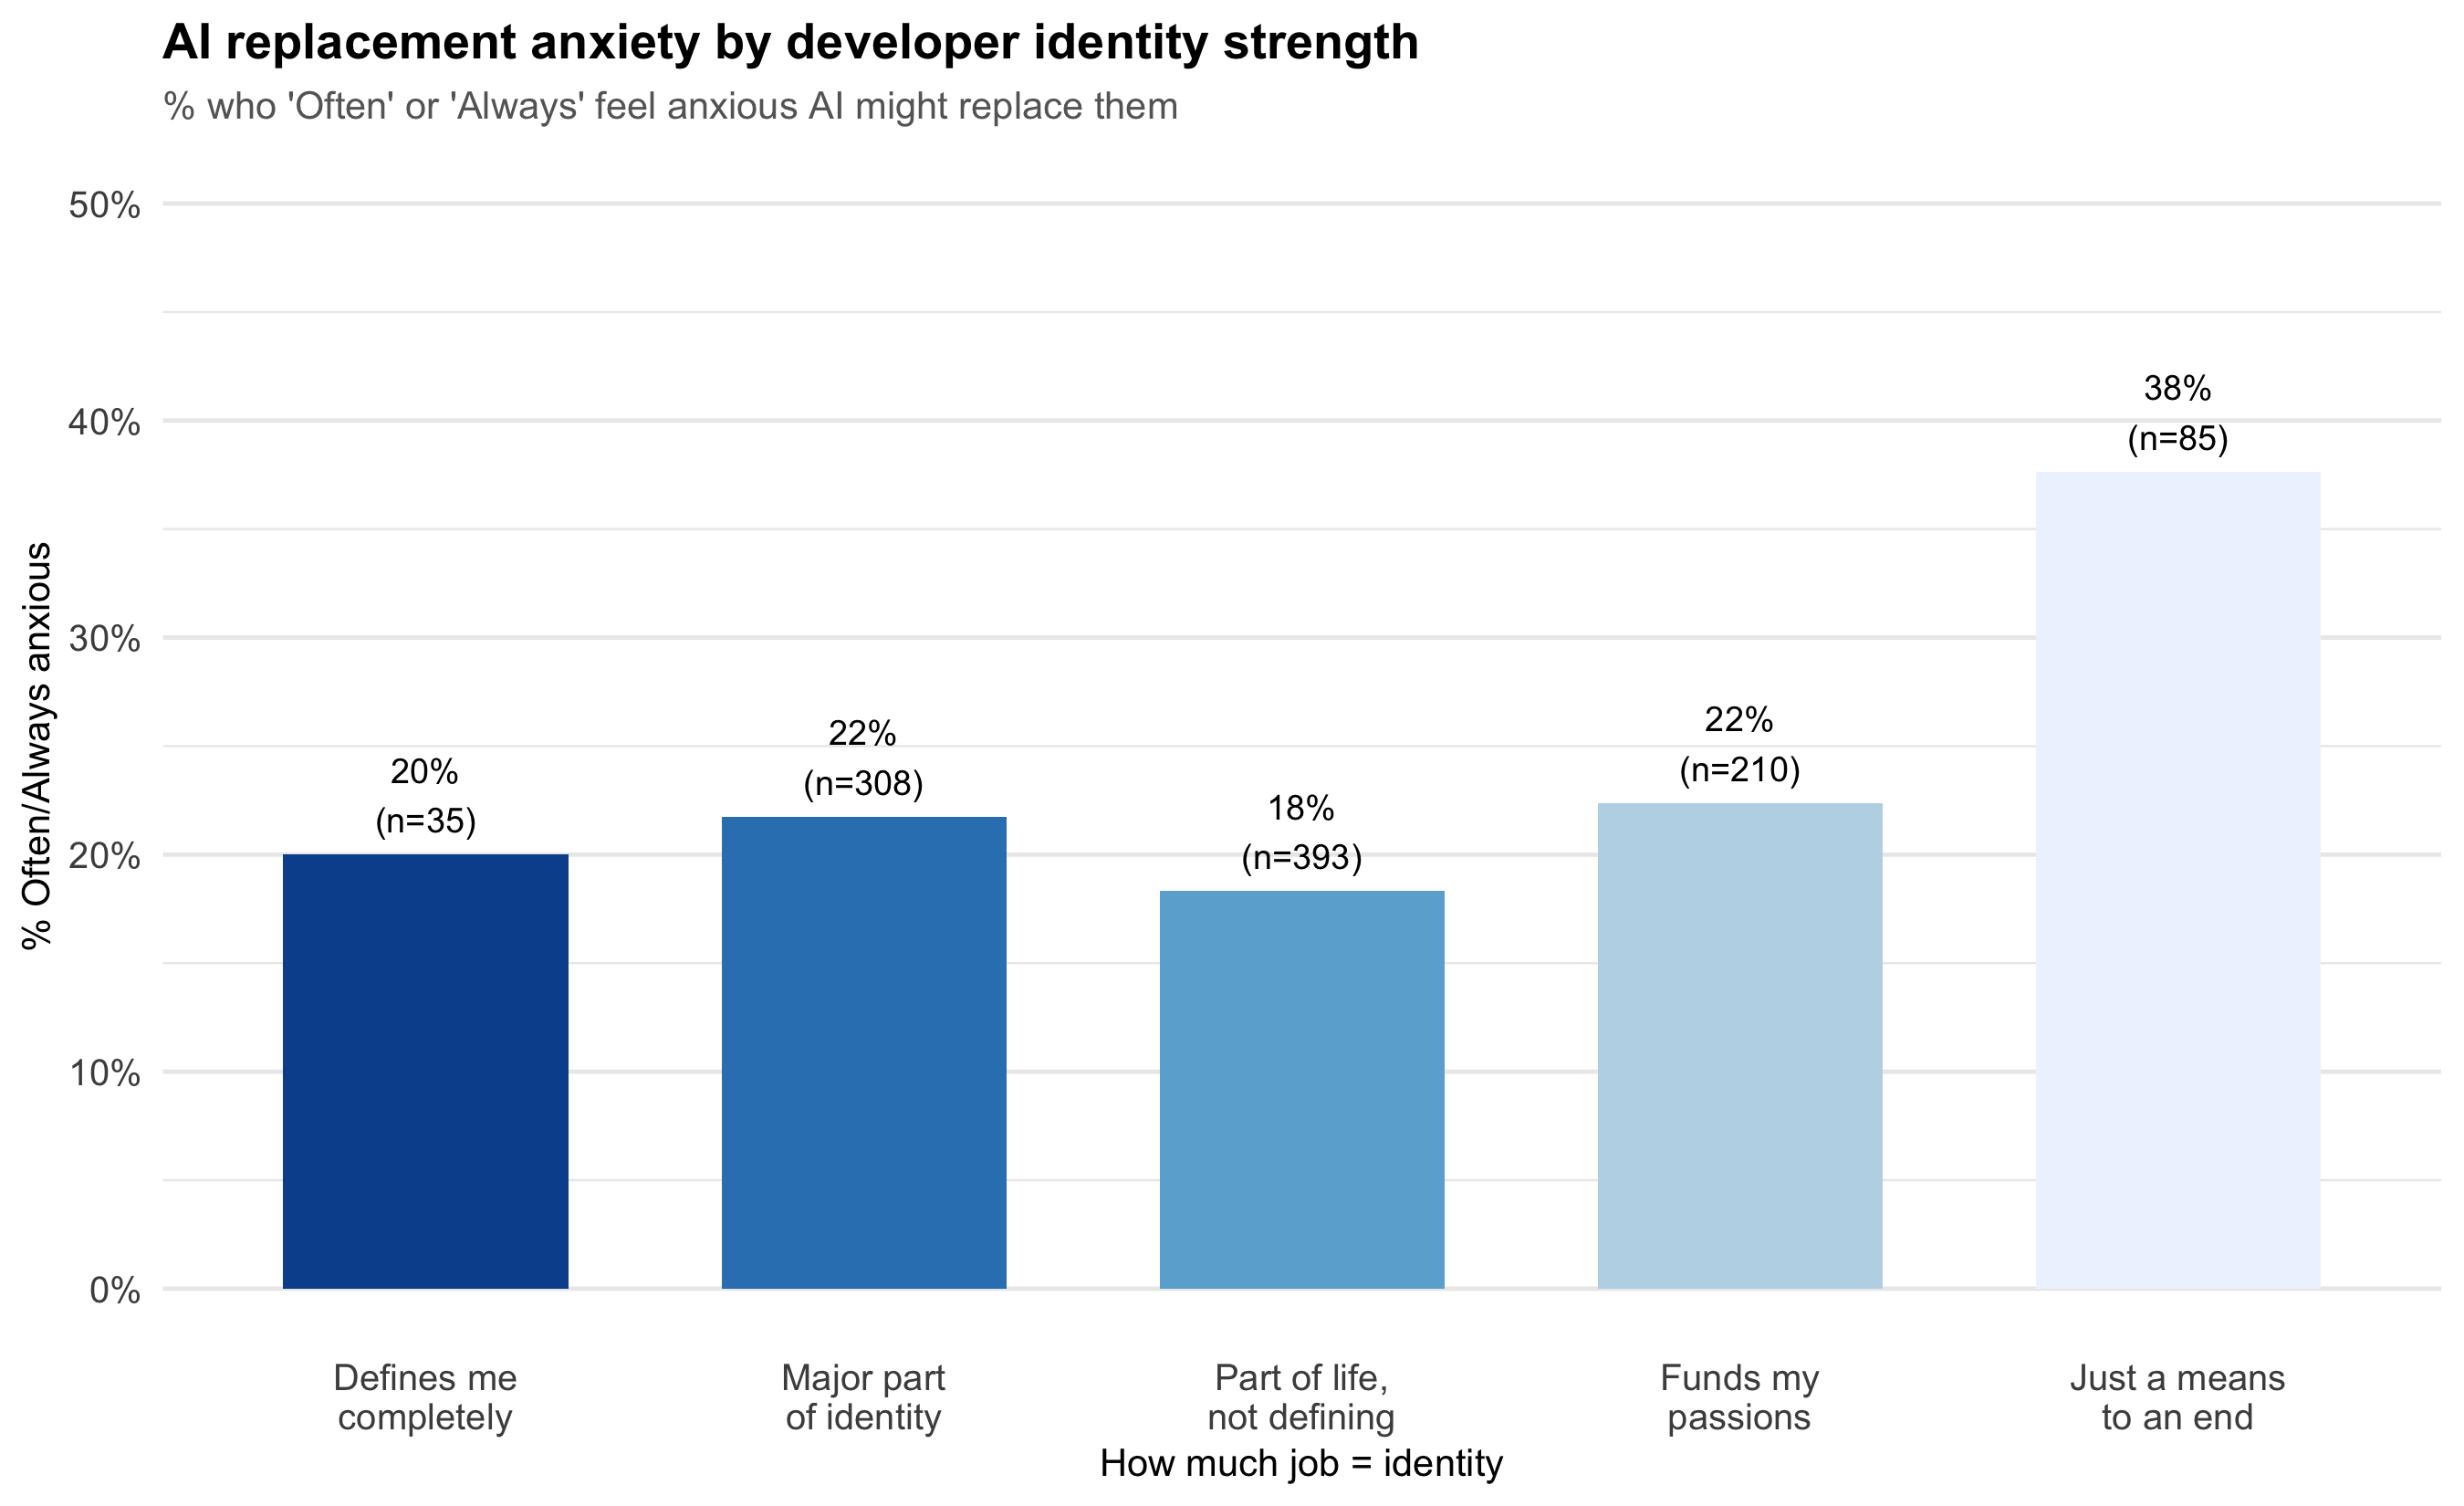
Ok, exploratory graph time. This was not what I expected to see!!
This could be unstable given the relatively small number of people in the "just a means to an end group" (we lost a lot of responses because of the survey logic probably, a relatively small subset answered the questions in combo I wanted to look at).
@grimalkina Could a point plot with CI whiskers give this more context? I don’t know what the R/ggplot2 equivalent would be to seaborn’s point plot function. I agree with the subsample size concern, and this is how I’d address it if I had the data open in front of me.
@grimalkina Or even just standard error whiskers would be helpful, honestly

Install bonfire.cafe
Get the full app experience