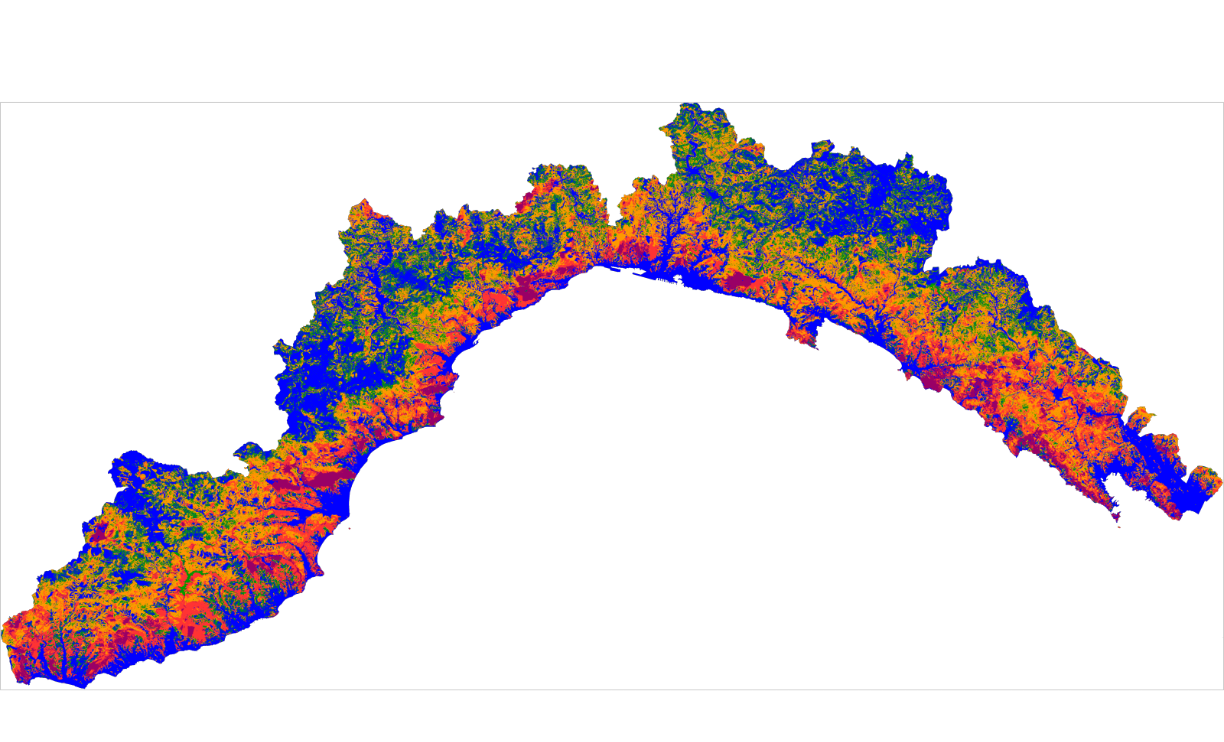
This is a map showing fire risk in the summer season in Liguria, in 5 discrete risk classes. It's an official map https://geoportal.regione.liguria.it/catalogo/mappe.html?typeEvent=detailFromHome&idmap=1454
The original map is a GeoTIFF with three channels for RGB colours. Querying a point will show data like (255, 153, 0) which is useless.
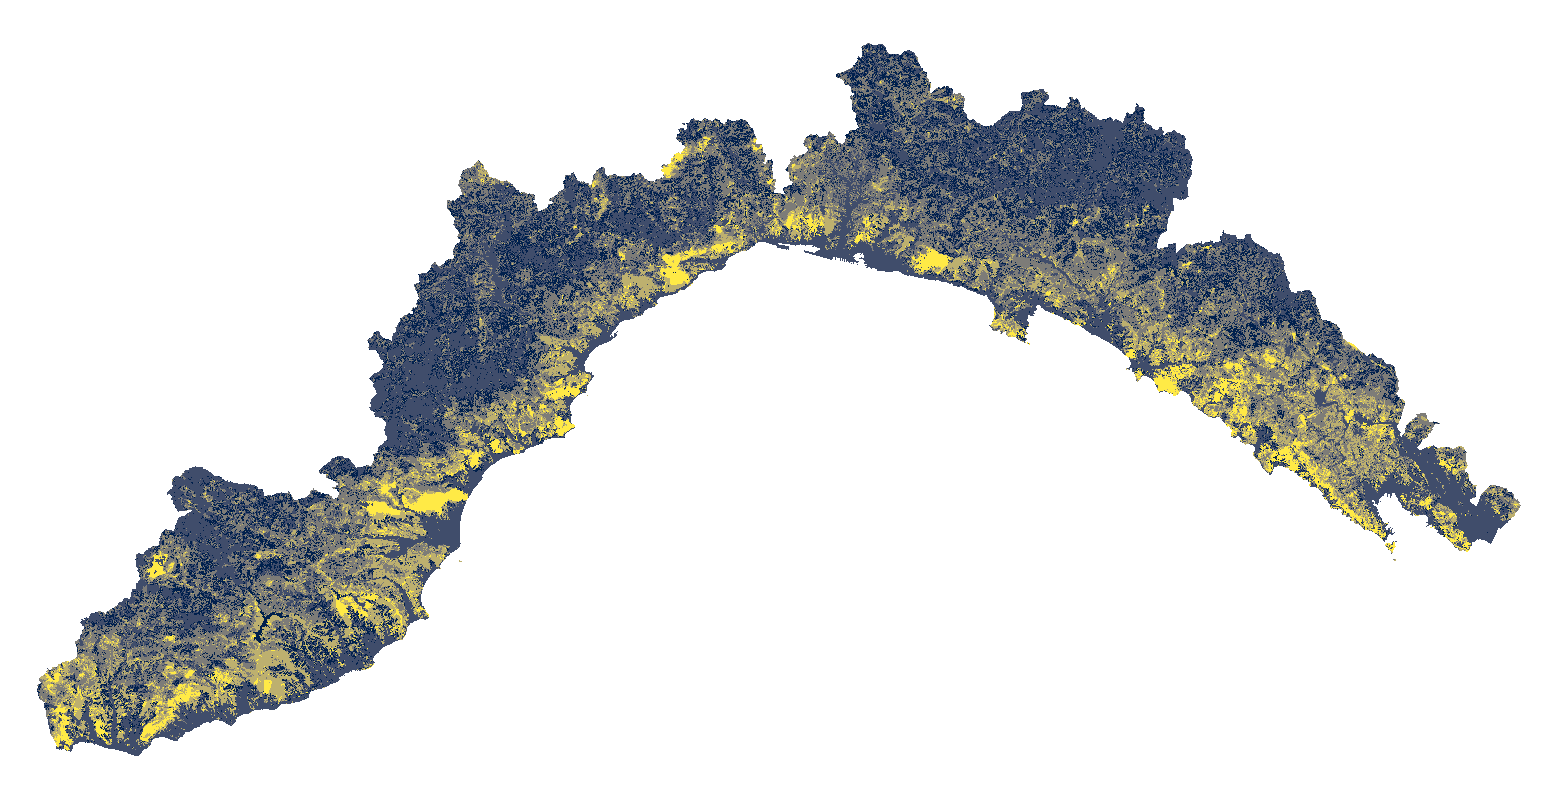
I did some GIS-fu with QGIS, rgb2pct and the calculator to obtain a 1-band raster where each pixel has the value corresponding to the risk class. Then I applied the Cividis colour scale.
2 media