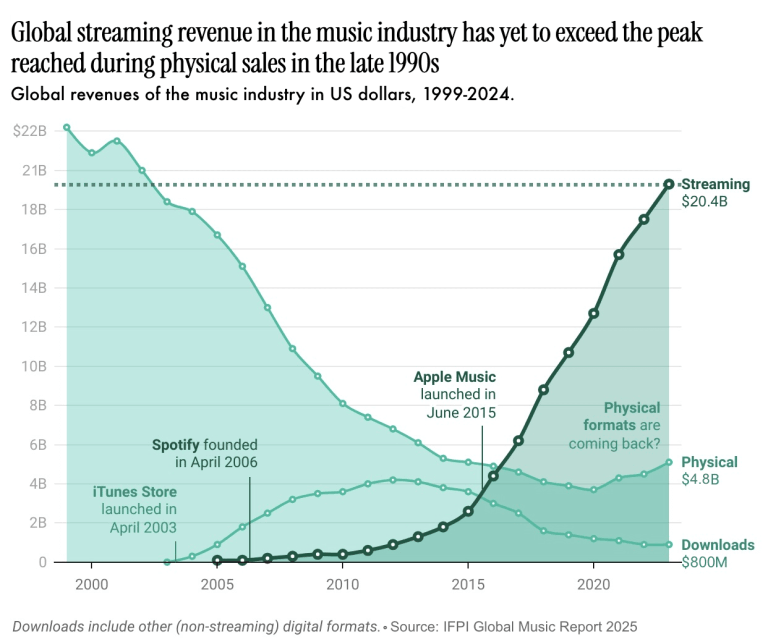
A line and area chart titled “Global streaming revenue in the music industry has yet to exceed the peak reached during physical sales in the late 1990s” showing worldwide music industry revenues in US dollars from 1999 to 2024. The vertical axis ranges from 0 to about $22 billion and the horizontal axis shows years from 2000 to the early 2020s. A pale green shaded area represents overall revenue, starting just above $22B around 2000, declining steadily through the 2000s to a low near $5B in the mid 2010s, then rising again to around $20B by 2024. A dashed horizontal line marks the late 1990s peak slightly above $20B, indicating current revenues approach but do not surpass that earlier high. Three lines break down formats: a dark green line for streaming rises sharply from near zero around 2010 to about $20.4B by 2024; a lighter green line for physical formats falls from over $20B in 2000 to about $4.8B by 2024; and a very light line for downloads grows in the late 2000s to around $4B before declining to about $800M. Annotations mark milestones including “iTunes Store launched in April 2003,” “Spotify founded in April 2006,” and “Apple Music launched in June 2015.” A note near the right suggests “Physical formats are coming back?” and labels on the right edge identify the final values for streaming, physical, and downloads, with a source credit to the IFPI Global Music Report 2025.