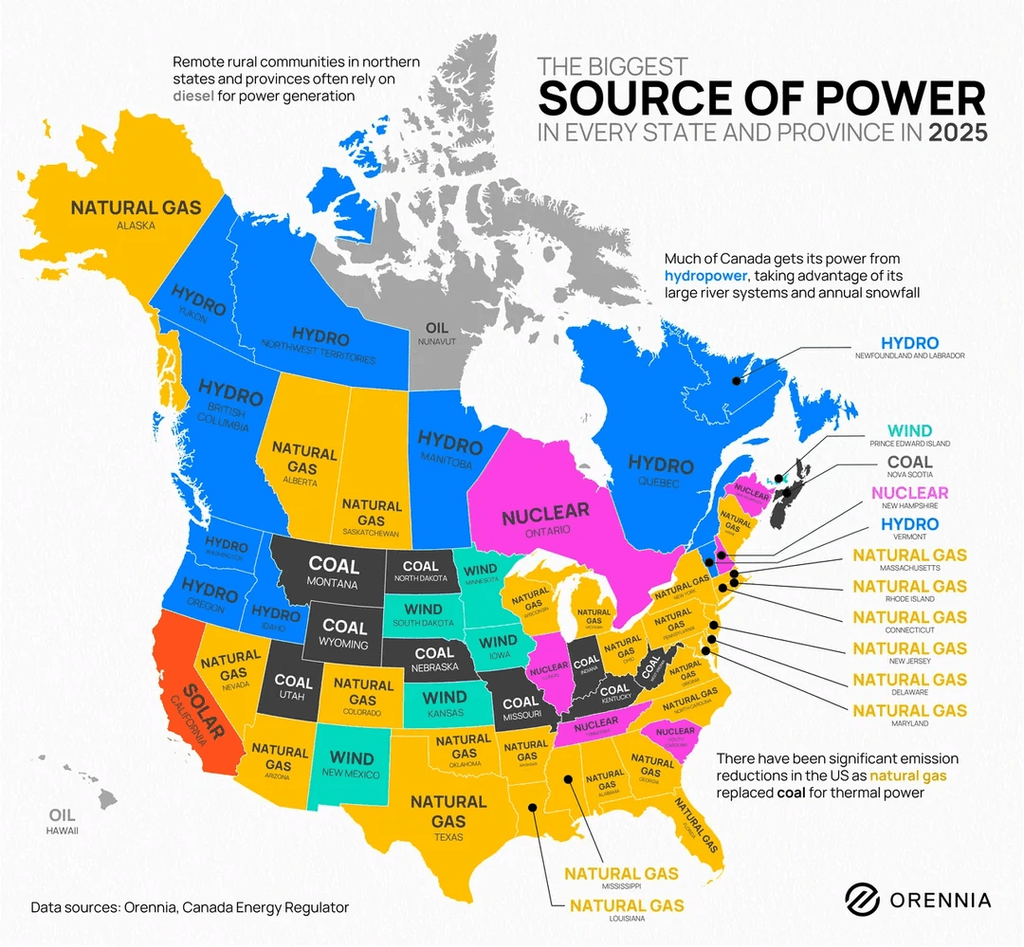
A colorful map titled “The Biggest Source of Power in North America 2022” showing the dominant electricity generation source for each U.S. state and Canadian province. Regions are color coded by energy type, with blue indicating hydropower, yellow for natural gas, pink for nuclear, orange for coal, green for wind, and other colors for solar and additional sources. In Canada, most provinces are shaded blue, highlighting hydropower as the primary source, especially in Quebec, British Columbia, and Manitoba. In the United States, the pattern is more varied, with large areas of the Midwest and parts of the West in yellow for natural gas, while coal remains dominant in some central states shown in orange. Nuclear power appears as the leading source in a few states in pink, and wind power dominates in parts of the central plains in green. Smaller pockets of solar and other sources appear in select regions. A legend on the right lists the energy types with corresponding colors, and the map emphasizes regional differences in how electricity is generated across North America.