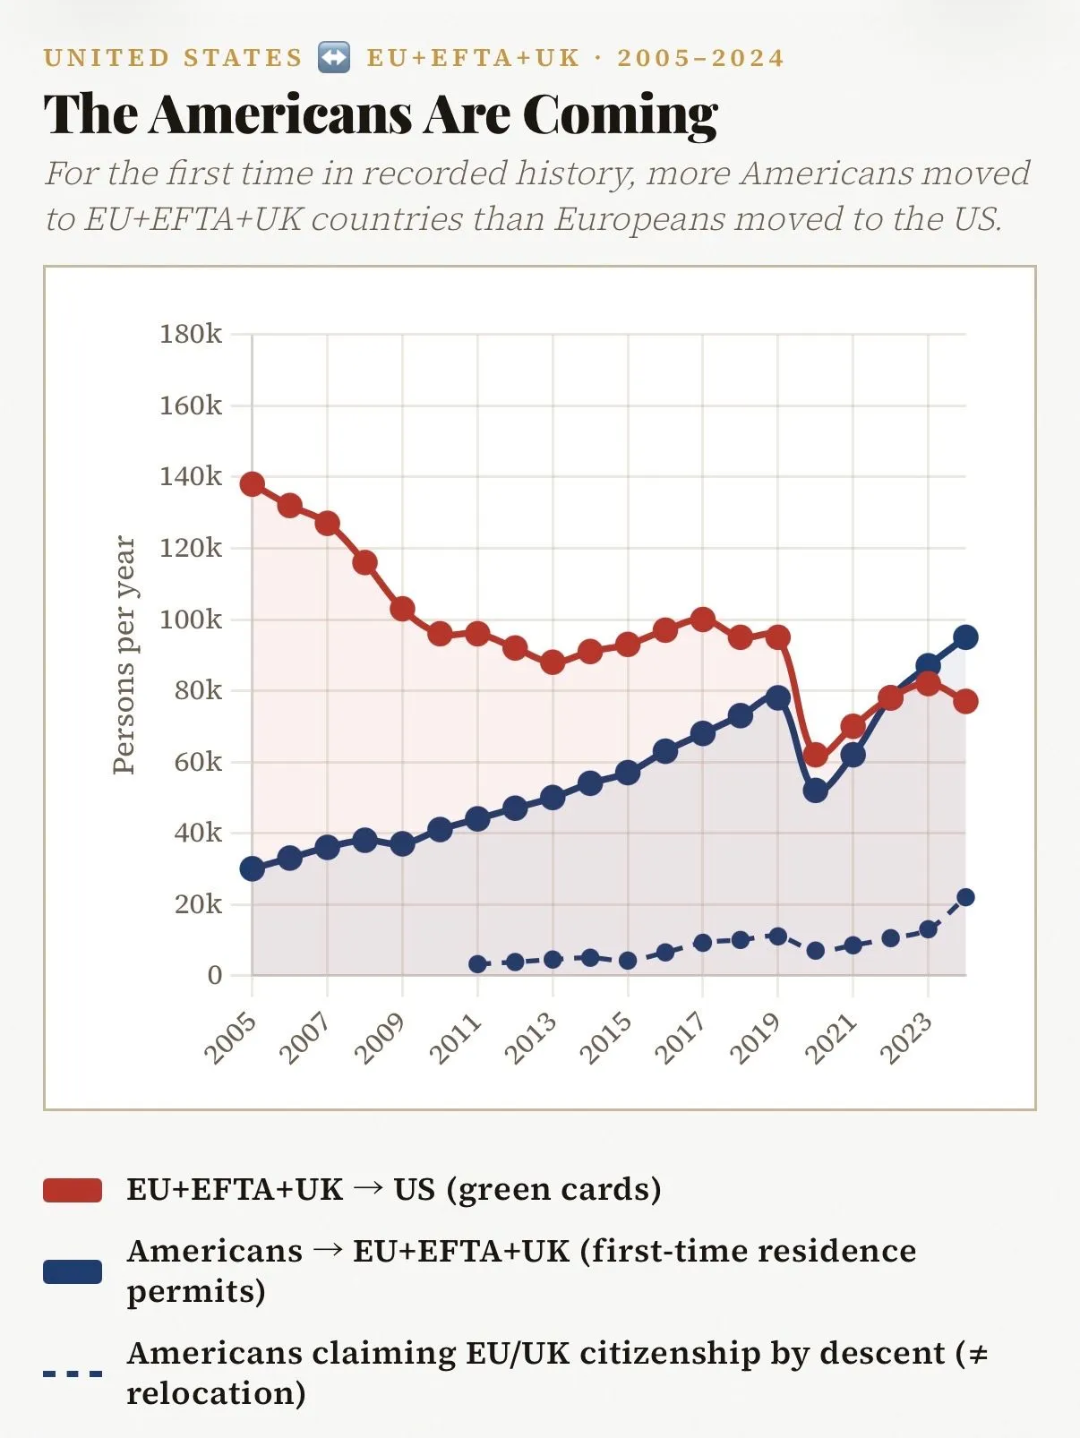
A line graph with a headline and article lead, showing migration trends from 2005 to 2024. The headline reads 'The Americans Are Coming' with the subtitle 'UNITED STATES <-> EU+EFTA+UK . 2005-2024'. Below the headline, the text reads 'For the first time in recorded history, more Americans moved to EU+EFTA+UK countries than Europeans moved to the US.' The main line graph plots 'Persons per year' from 0 to 180k on the y-axis, against years from 2005 to 2023 on the x-axis. Three data series are shown with a corresponding legend below. The first data series, represented by a red line with solid circles, is 'EU+EFTA+UK -> US (green cards)'. It shows a declining trend, with a sharp drop in 2020 and a smaller drop in 2023, while generally higher than the other series. The second series, a solid dark blue line with solid circles, is 'Americans -> EU+EFTA+UK (first-time residence permits)'. This series shows a distinct upward trend, particularly accelerating in recent years. In the final year of the graph, this solid blue line crosses above the red line, reaching its highest point and surpassing the migration from Europe. The third series, a dark blue dotted line with solid circles that begins around 2011, is 'Americans claiming EU/UK citizenship by descent (≠ relocation)'. This series remains low throughout, but also shows a clear recent increase. The visual summary is that migration from the US to the combined European area now exceeds migration in the other direction.