Discussion
Loading...

Post

Log in
  • About
  • Code of conduct
  • Privacy
  • Users
  • Instances
  • About Bonfire
MastoBlaster - Official Account
@mastoblaster@mastoblaster.app  ·  activity timestamp 4 days ago

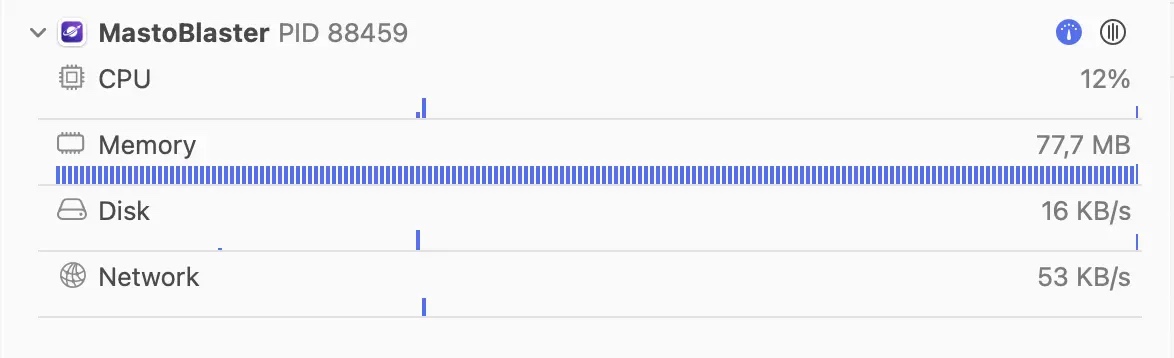
MastoBlaster debugger in Timeline view.
I’m trying to keep the resources consumption as low as possible.

(Posted using MastoBlaster on macOS Tahoe - which is totally usable)

#MastoBlaster

Screenshot of the Xcode debugger timeline view showing the process “MastoBlaster” (PID 88459) running with low activity: CPU at 12%, memory usage around 77.7 MB, disk activity at 16 KB/s, and network activity at 53 KB/s, with mostly minimal spikes in the activity graphs.
  • Copy link
  • Flag this post
  • Block

bonfire.cafe

A space for Bonfire maintainers and contributors to communicate

bonfire.cafe: About · Code of conduct · Privacy · Users · Instances
Bonfire social · 1.0.2-alpha.34 no JS en
Automatic federation enabled
Log in
Instance logo
  • Explore
  • About
  • Members
  • Code of Conduct