Discussion
Loading...

Post

Log in
  • About
  • Code of conduct
  • Privacy
  • Users
  • Instances
  • About Bonfire
HeavenlyPossum
HeavenlyPossum
@HeavenlyPossum@kolektiva.social  ·  activity timestamp 5 hours ago

Jonathan Nitzan and Shimshon Bichler are a pair of anarchist economists whose work I’ve plugged before. Their approach to capitalism draws on Marx’s previous work, but rejects his labor theory of value and concept of socially necessary labor time as ways of explaining capitalist exploitation of labor.

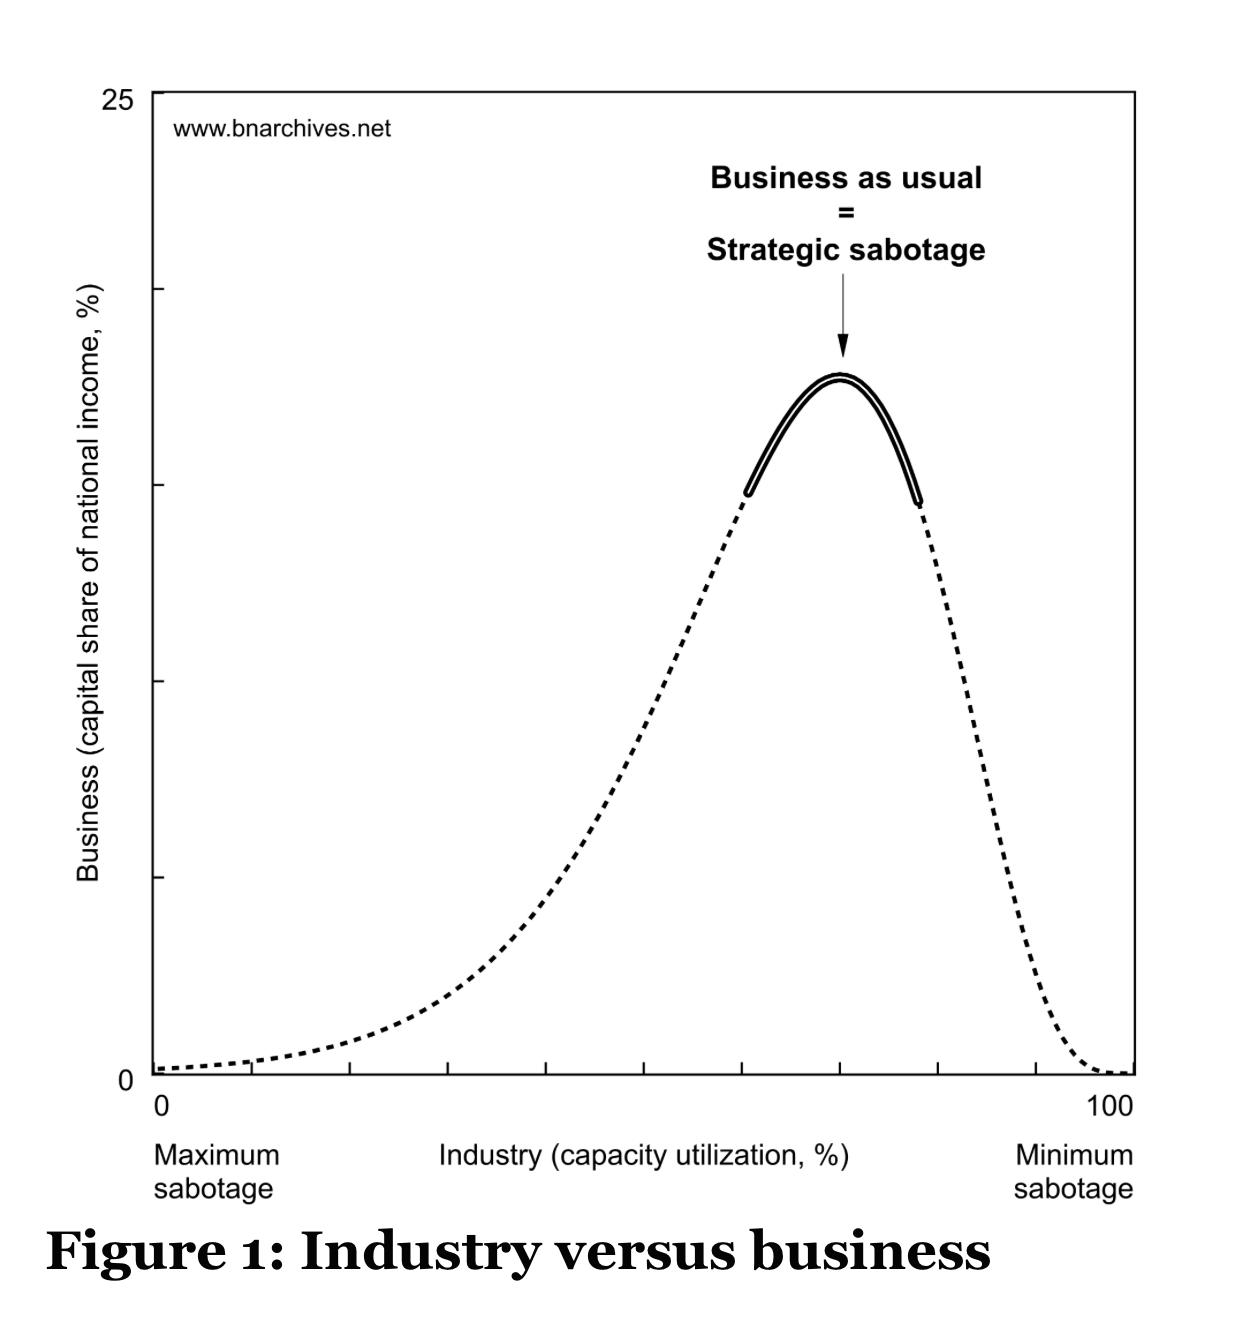
Instead, their work draws on Thorstein Veblen’s concept of industrial sabotage to explain exploitation. Capitalists are not just unnecessary for production, the argument goes, but actively hostile to it, because they can only collect income by threatening to interfere with, or to sabotage, production.

1/4

  • Copy link
  • Flag this post
  • Block
Michael Bacon
Michael Bacon
@MichaelTBacon@social.coop replied  ·  activity timestamp 2 hours ago

@HeavenlyPossum Capital as Power was such a frustrating book. The first half of it was great, and I love their revival of Veblen and the centering of his discussion of control of the means of sabotage. I think about that a lot.

But the second half was just a mess.

They wanted to reach for a major theory and I respect them for that but to me it just fell apart once they tried to get practical.

  • Copy link
  • Flag this comment
  • Block
HeavenlyPossum
HeavenlyPossum
@HeavenlyPossum@kolektiva.social replied  ·  activity timestamp 5 hours ago

Workers are disciplined by the threat of having their ability to labor productively *sabotaged* by capitalist workers. This idea is, of course, identical to Marx’s reserve army of the unemployed—those people that capitalists deliberately keep hungry and homeless as an implicit threat to workers.

Nitzan and Bichler view unemployment not just as a threat for disciplining labor, but as part of a mechanism of wealth extraction that we can empirically model and measure. Take a look at the image below, in which they propose a model for sabotage through unemployment. A graph of the capital share of national income as a function of unemployment should produce a rough bell curve: too little sabotage and capitalists are eschewing income by leaving money on the table; too much sabotage and there’s not enough economic activity to skim off the top. The sweet spot of sabotage should be somewhere in the middle, an ideal but moving target of unemployment that maximizes capitalists’ income.

2/4

A graph labeled “Figure 1: Industry versus business. The X axis is labeled “industry (capacity utilization, percentage)” and ranges from maximum sabotage to minimum sabotage. The Y axis is labeled business (capital share of national income, percentage). The graph itself depicts a rough bell curve shape, with the top of the curve highlighted and labeled “business as usual equals strategic sabotage.”
  • Copy link
  • Flag this comment
  • Block
HeavenlyPossum
HeavenlyPossum
@HeavenlyPossum@kolektiva.social replied  ·  activity timestamp 5 hours ago

When they actually measured the capital share of national income as a function of unemployment, they found a curve that looks an awful lot like their model, with the unemployment rate appearing to converge, over time, at around 6-7%. Capital’s share of national income is highest around this sweet spot.

An ideal level of sabotage is clearly a moving target for capital; the graph meanders quite a bit but that line seems to keep coming back to an unemployment rate that also corresponds to a higher share of national income going to business profits and interest payments to creditors.

3/4

https://bnarchives.net/id/eprint/760/3/20230100_bn_the_business_of_strategic_sabotage.html

A graph with the X axis labeled “industry (unemployment rate, inverted, percentage) and the Y axis labeled “business (profit and net interest share of national income, percentage. ). The resulting curve is a bit more tangled than the previous graph’s smooth parabola, but it does follow roughly the same path and shows a clear concentration around a 6-7 percent unemployment rate, with the capital share of national income peaking in 1985 around 18.5 percent.
  • Copy link
  • Flag this comment
  • Block
HeavenlyPossum
HeavenlyPossum
@HeavenlyPossum@kolektiva.social replied  ·  activity timestamp 5 hours ago

That’s just something that came to mind when I saw headlines describing the US labor market, with hiring at its lowest level since the 2020 recession triggered by COVID.

I don’t know if Trump is driving up unemployment intentionally or not, but business elites did quite explicitly throw their support behind his 2024 campaign on the grounds that labor had it too good under Biden and needed to be disciplined by a tougher job market.

So whether it’s intentional or not, Trump is very clearly playing the role he was selected for.

4/4

https://m.economictimes.com/news/international/us/us-hiring-rate-falls-to-3-3-matching-covid-era-lows-and-signaling-recession-fears/amp_articleshow/128205471.cms

US Hiring Rate Hits 3.3% as Low-Hire Low-Fire Economy Grips 2026 Labor Market: US hiring rate falls to 3.3%, matching COVID-era lows and signaling Recession fears - The Economic Times

U.S. hiring rate fell to 3.3%, near a 13-year low, matching 2020 crisis levels. Payroll growth in 2025 was under 600,000 jobs versus a decade average of 1.9 million. Unemployment holds at 4.4%, while wage growth slows. Yet the broader U.S. economic growth rate has remained positive. GDP expanded at a solid pace through 2025. Hiring stalls despite economic expansion. Job seekers face limited opportunities. This unusual labor trend raises questions for policymakers.
  • Copy link
  • Flag this comment
  • Block

bonfire.cafe

A space for Bonfire maintainers and contributors to communicate

bonfire.cafe: About · Code of conduct · Privacy · Users · Instances
Bonfire social · 1.0.2-alpha.27 no JS en
Automatic federation enabled
Log in
  • Explore
  • About
  • Members
  • Code of Conduct