Discussion
Loading...

Post

Log in
  • About
  • Code of conduct
  • Privacy
  • Users
  • Instances
  • About Bonfire
Fabrizio Musacchio
Fabrizio Musacchio
@FabMusacchio@mastodon.social  路  activity timestamp 2 weeks ago

I studied at the #UniversityOfCologne and Susanne Crewell was one of my professors. Nice to see my #AlmaMater highlighting her work on such a relevant #climate topic!

馃實 https://www.researchsquare.com/article/rs-6837438/

#unicologne #cologne #climatechange #meteorology @UniKoeln https://wisskomm.social/@UniKoeln/115939584792859829

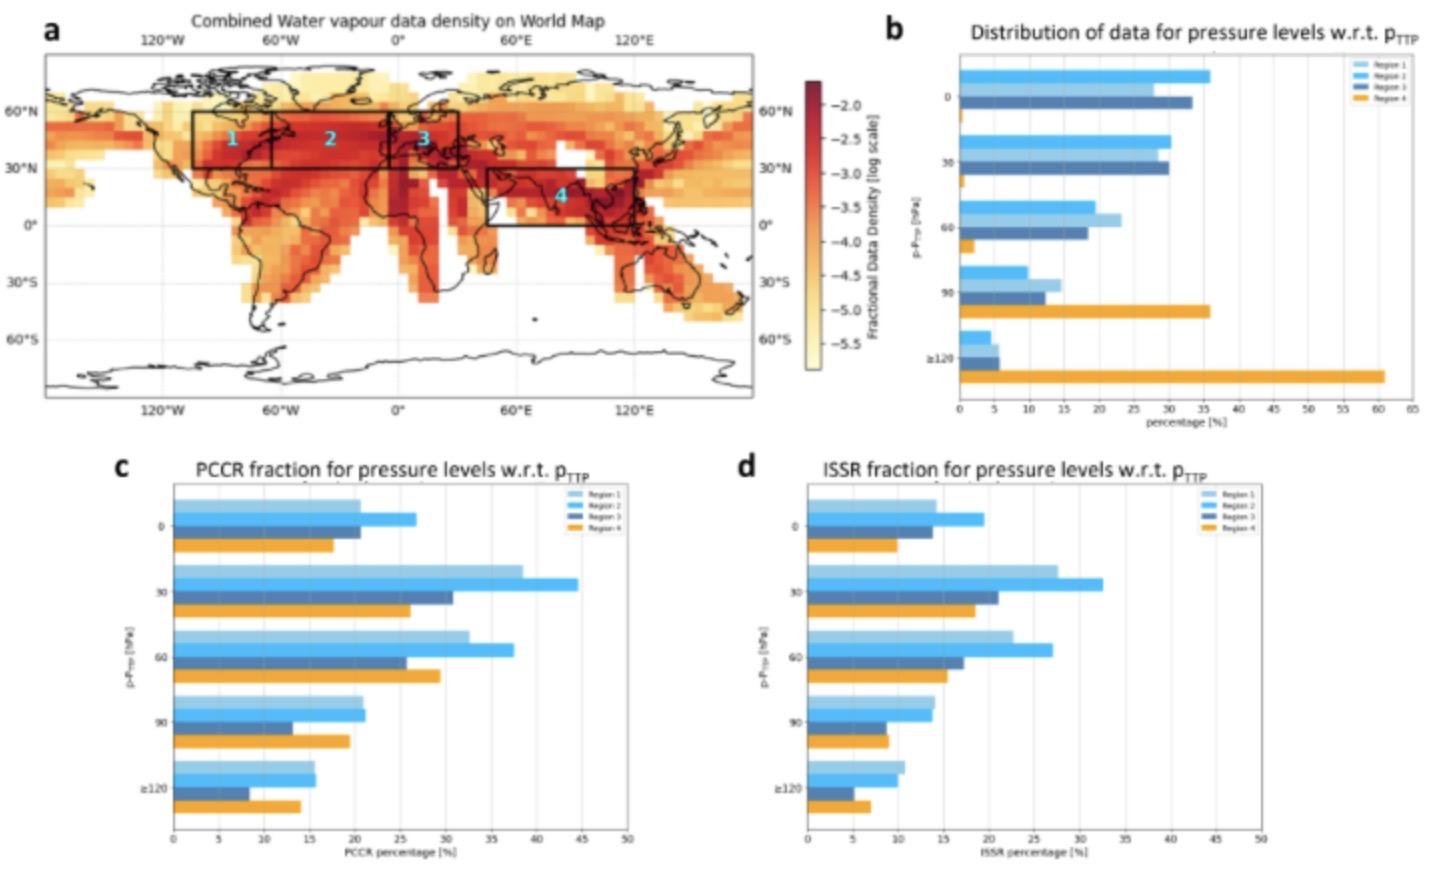
Figure 1. Panel (a): Fractional data density of IAGOS combined water vapor dataset from June 2014 to December 2021 (logarithmic scale used to visualize maximum data coverage); inserted boxes indicate the regions of interest Eastern North America (Region 1), the North Atlantic (Region 2), Western Europe (Region 3) and Southeast Asian Subtropics (Region 4); Panel (b): vertical distribution of data for four pressure levels of thickness 30 hPa relative to the pressure level of the thermal tropopause pTTP; Panel (c) fraction of potential contrail-cirrus regions (PCCR; RHice 鲁 90%) for each pressure level; Panel (d) same as Panel (c) but for ice-supersaturated regions.
  • Copy link
  • Flag this post
  • Block

bonfire.cafe

A space for Bonfire maintainers and contributors to communicate

bonfire.cafe: About 路 Code of conduct 路 Privacy 路 Users 路 Instances
Bonfire social 路 1.0.2-alpha.7 no JS en
Automatic federation enabled
Log in
  • Explore
  • About
  • Members
  • Code of Conduct