black and white picture
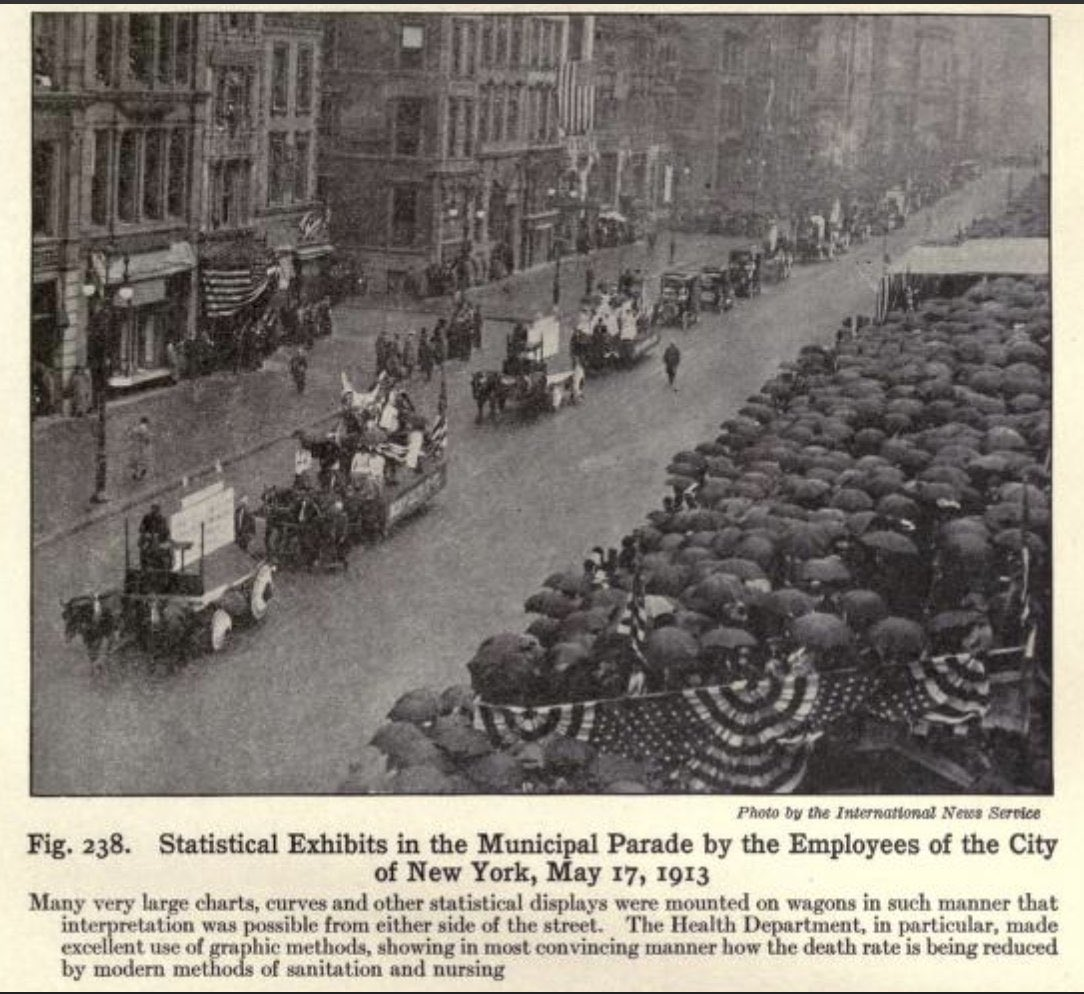
Fig. 238. Statistical Exhibits in the Municipal Parade by the Employees of the City of New York, May 17, 1013
Many very large charts, curves and other statistical displays were mounted on wagons in such manner that interpretation was possible from either side of the street. The Health Department, in particular, made excellent use of graphic methods, showing in most convincing manner how the death rate is being reducedby modern methods of sanitation and nursing