Discussion
Loading...

Post

Log in
  • About
  • Code of conduct
  • Privacy
  • Users
  • Instances
  • About Bonfire
Stefano Marinelli
Stefano Marinelli
@stefano@mastodon.bsd.cafe  ·  activity timestamp 6 hours ago

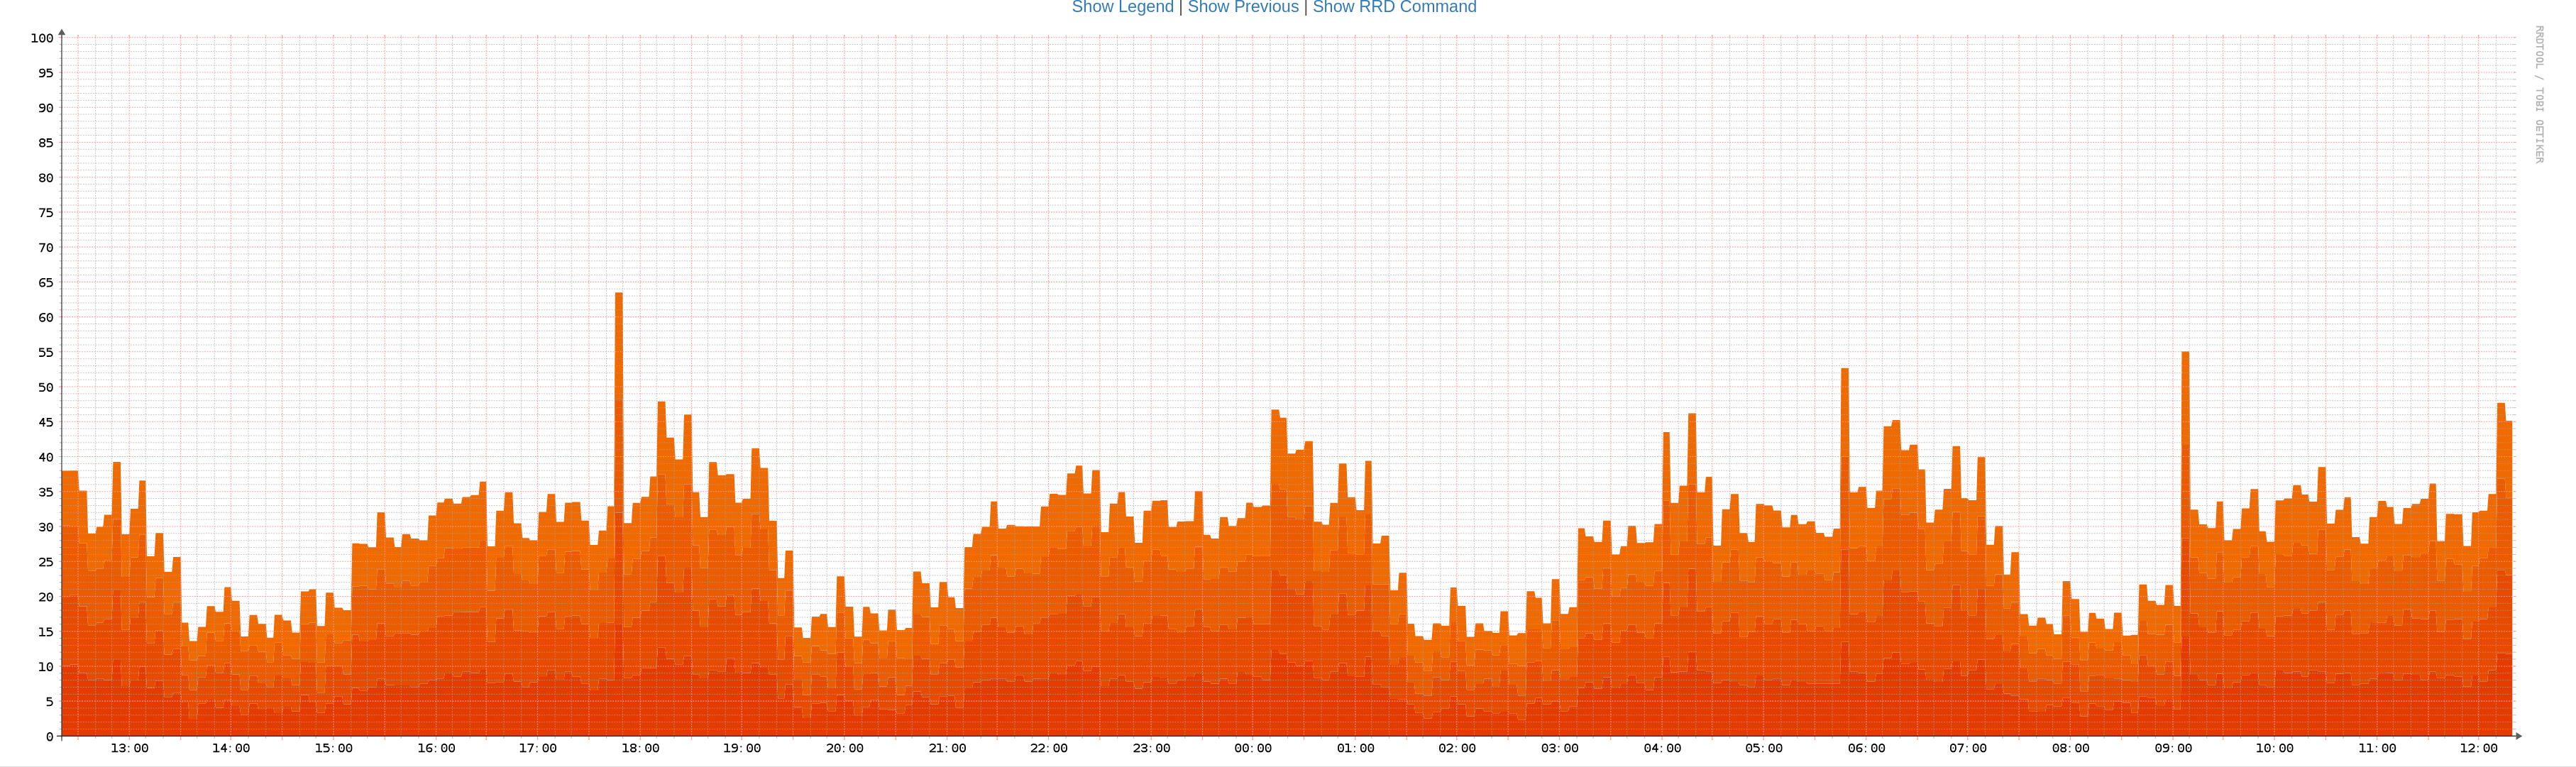
Here is the CPU usage graph for the last 24 hours of the FediMeteo VM. A full 24 hours, during which a huge number of people are connecting, helped by the traction gained from being among the top stories on Hacker News and Lobsters, as well as the many shares across the Fediverse.

RAM usage? Active, around 450 MB. Then there is cache, ARC, and so on. But in practice, zero swap in use after days of uptime.

39 jails running, 39 snac instances, nginx serving the homepage, and HAProxy. HAProxy caching enabled. ZFS snapshots every 15 minutes, backups via zfs send and receive every hour. The same hourly schedule applies to the recalculation of cities, countries, and followers for the homepage.

All of this on a 4 euro per month FreeBSD VM.

If anyone has doubts about the quality and efficiency of FreeBSD, this is the data to show.

#FediMeteo #FreeBSD #RunBSD #IT #SysAdmin

Time series graph showing CPU usage percentage over roughly 24 hours. The x axis represents time from about 13:00 to 12:00 the next day, and the y axis shows CPU usage from 0 to 100 percent. CPU usage fluctuates mostly between 15 and 35 percent, with periodic rises during daytime and early morning hours. Several short spikes reach around 45 to 55 percent, and one brief peak climbs to about 60 percent. Usage drops to lower levels, around 10 to 20 percent, during late evening and early morning periods. Overall, the graph shows moderate, variable CPU load with occasional sharp peaks.
  • Copy link
  • Flag this post
  • Block

bonfire.cafe

A space for Bonfire maintainers and contributors to communicate

bonfire.cafe: About · Code of conduct · Privacy · Users · Instances
Bonfire social · 1.0.1-alpha.41 no JS en
Automatic federation enabled
Log in
  • Explore
  • About
  • Members
  • Code of Conduct