Here's an alt-text description of the image:
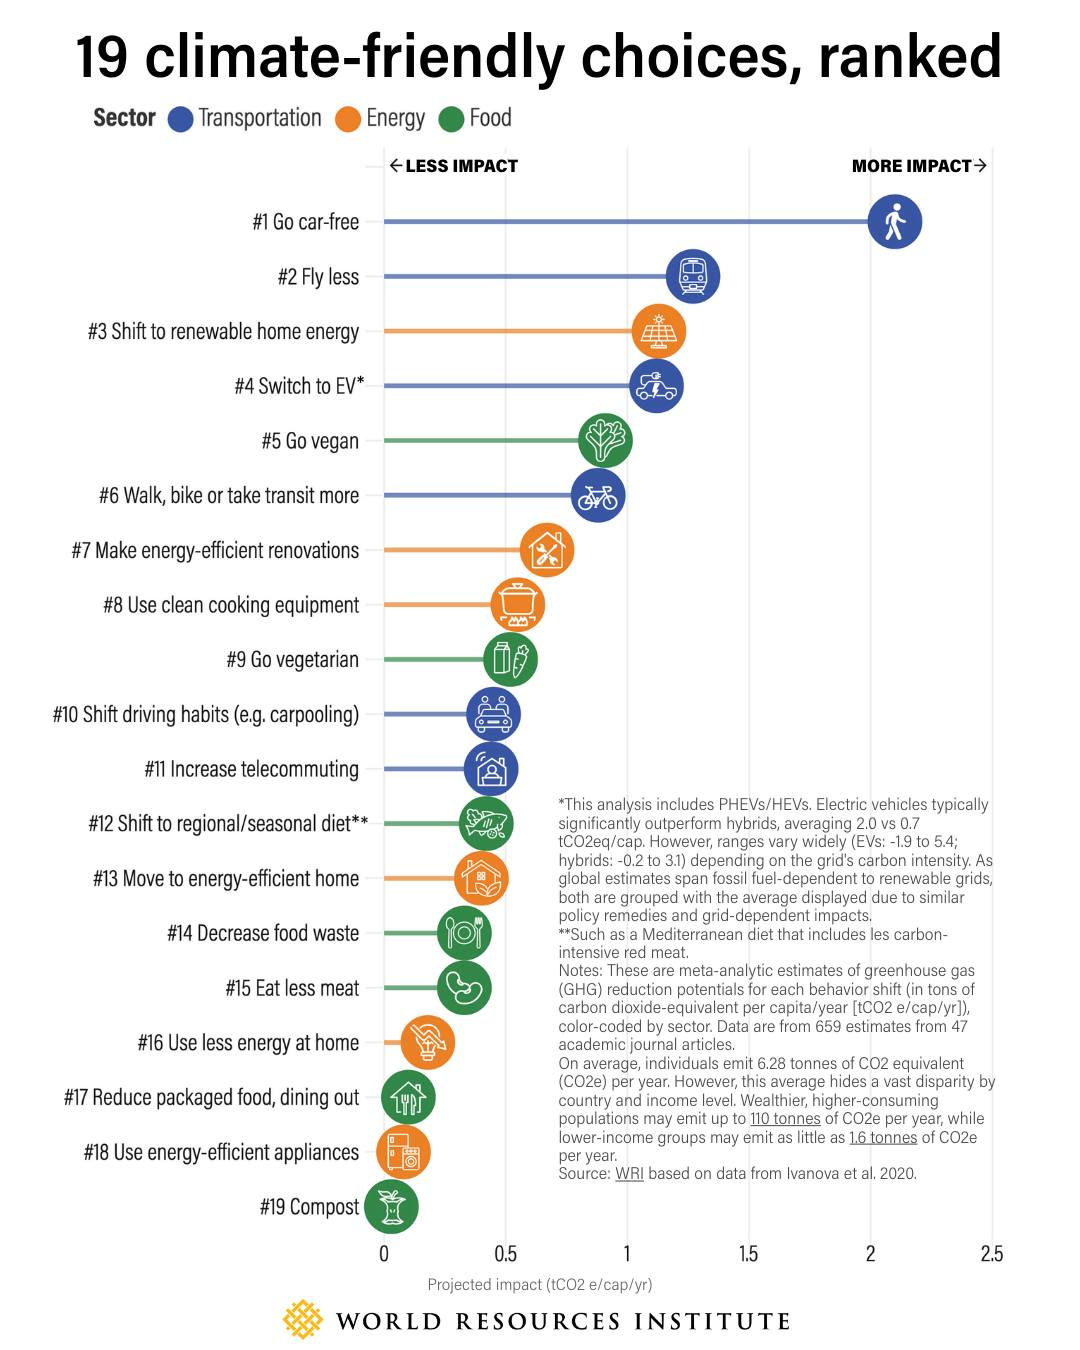
This image is a vertically oriented infographic titled “19 climate-friendly choices, ranked.” It depicts a list of 19 actions individuals can take to reduce their carbon footprint, categorized by sector: transportation, energy, and food. The actions are arranged from highest to lowest impact, with a bar graph alongside each action indicating its projected impact in tonnes of CO2 equivalent per year (tCO2e/yr). The highest impact choice, “#1 Go car-free”, has a bar extending to 2.5 tCO2e/yr. The actions range in impact, decreasing towards a bar of roughly 0 tCO2e/yr at “#19 Compost”. The bottom of the graphic features the text “Source: WRI based on data from Ivanova et al 2020.”
Here’s a detailed list of the actions, numbered 1 through 19:
Go car-free
Fly less
Shift to renewable home energy
Switch to EV*
Go vegan
Walk, bike or take transit more
Make energy-efficient renovations
Use clean cooking equipment
Go vegetarian
Shift driving habits (e.g. carpooling)
Increase telecommuting
Shift to regional/seasonal diet**
Move to energy-efficient home
Decrease food waste
Eat less meat
Use energy at home
Reduce packaged food, dining out
Use energy-efficient appliances
Compost