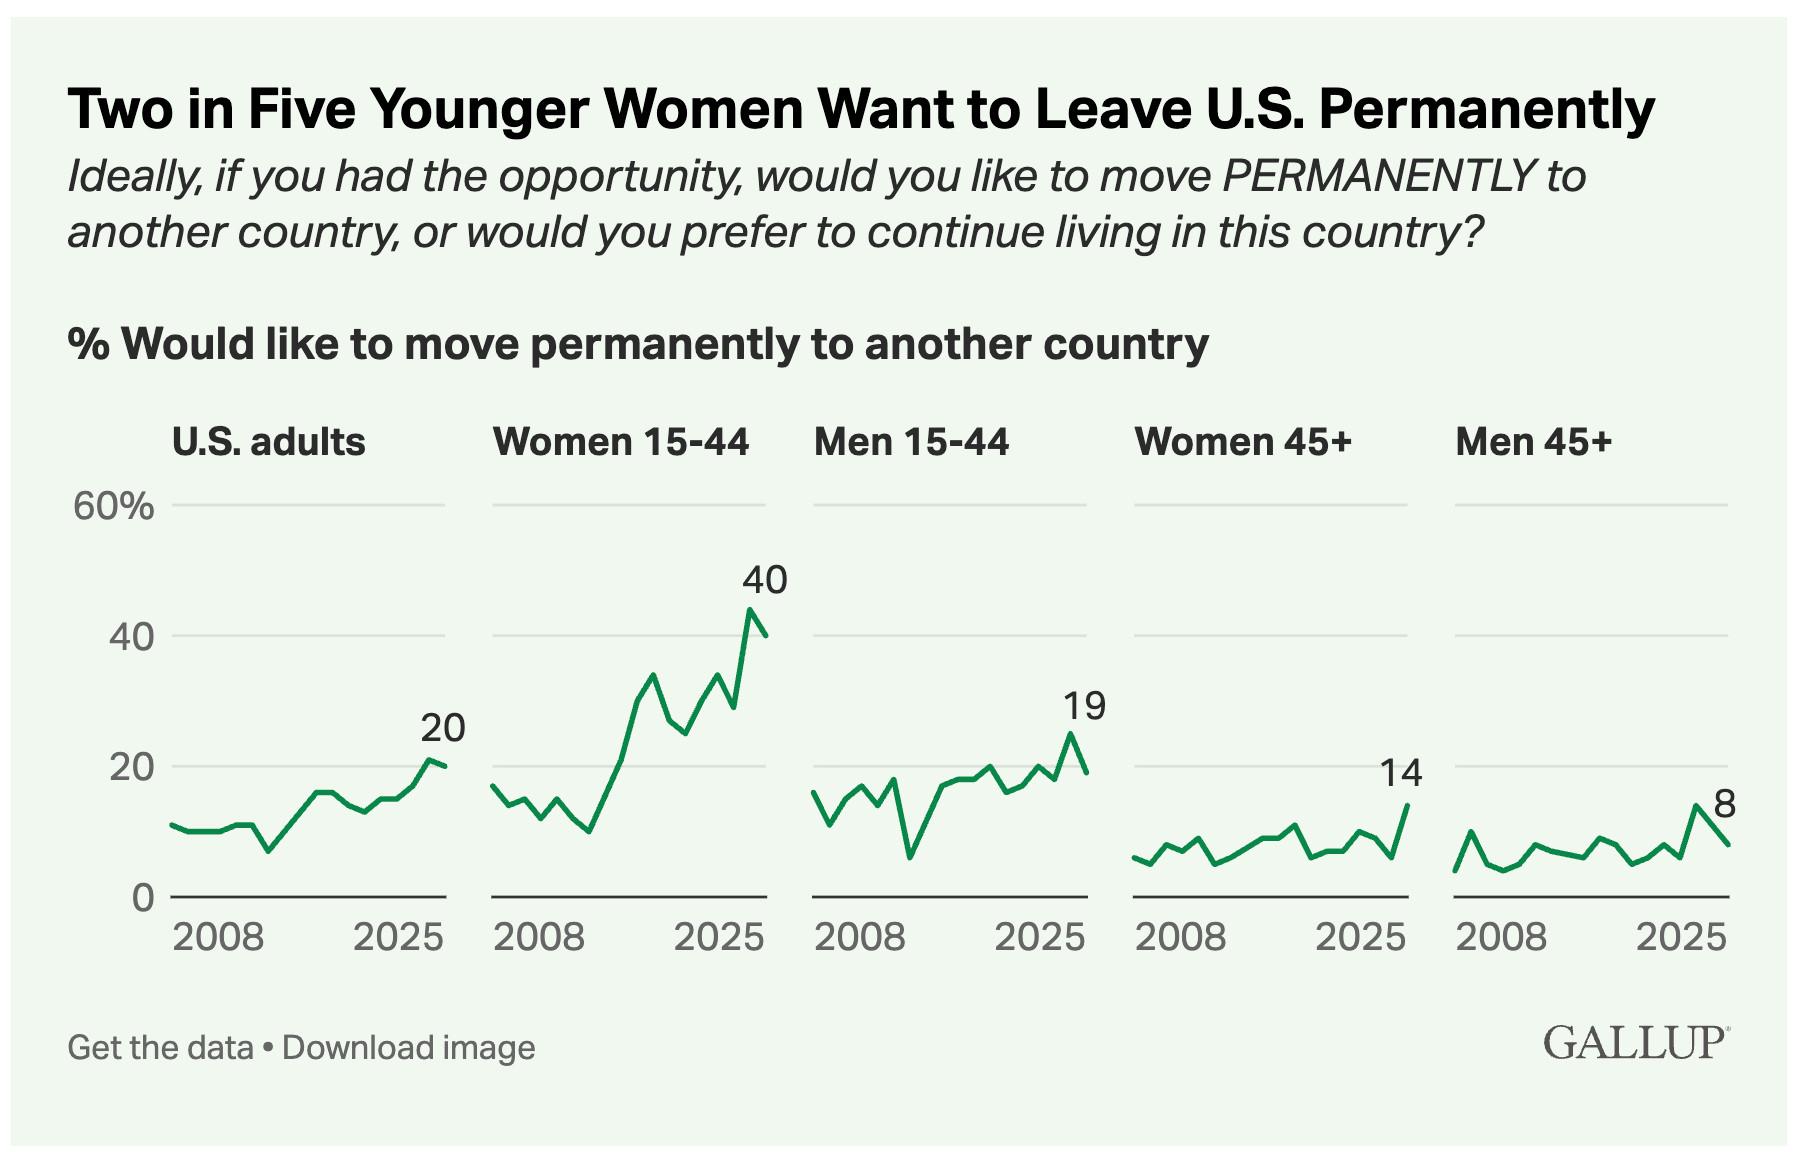
This image is a data visualization chart from Gallup with the headline: "Two in Five Younger Women Want to Leave U.S. Permanently".
The chart presents data showing the percentage of different U.S. demographic groups who would like to move PERMANENTLY to another country, based on the question: "Ideally, if you had the opportunity, would you like to move PERMANENTLY to another country, or would you prefer to continue living in this country?"
📊 Chart Breakdown
The image contains five line graphs, each tracking the percentage over time, roughly from 2008 to 2025:
* U.S. Adults: The overall percentage reached 20% in 2025.
* Women 15-44 (Younger Women): This group shows the highest desire to leave, peaking at 40% in 2025.
* Men 15-44 (Younger Men): This percentage reached 19% in 2025.
* Women 45+ (Older Women): This percentage reached 14% in 2025.
* Men 45+ (Older Men): This group shows the lowest desire to leave, reaching 8% in 2025.
📝 Key Takeaway
The data indicates a significant increase in the desire to permanently leave the U.S. across all demographics, with Younger Women (15-44) having the strongest desire to move abroad (40\%), and Older Men (45+) having the least (8\%).
Would you like to know more about the data for a specific group, or would you like to compare the trends?