

This image is a graphical timeline chart illustrating the history of major empires and civilizations from 4000 BCE to 2000 AD.
The chart is organized along two axes:
Vertical Axis: Time flows from the bottom of the image to the top. It begins at 4000 BCE and is marked at intervals of 1000 years (3000 BC, 2000 BC, 1000 BC), then at 500-year intervals from the BC/AD line up to 2000 AD.
ALT description in subsequent replies #history #offrehacked
Picture is not mine - just found it on the net
Discussion
Loading...
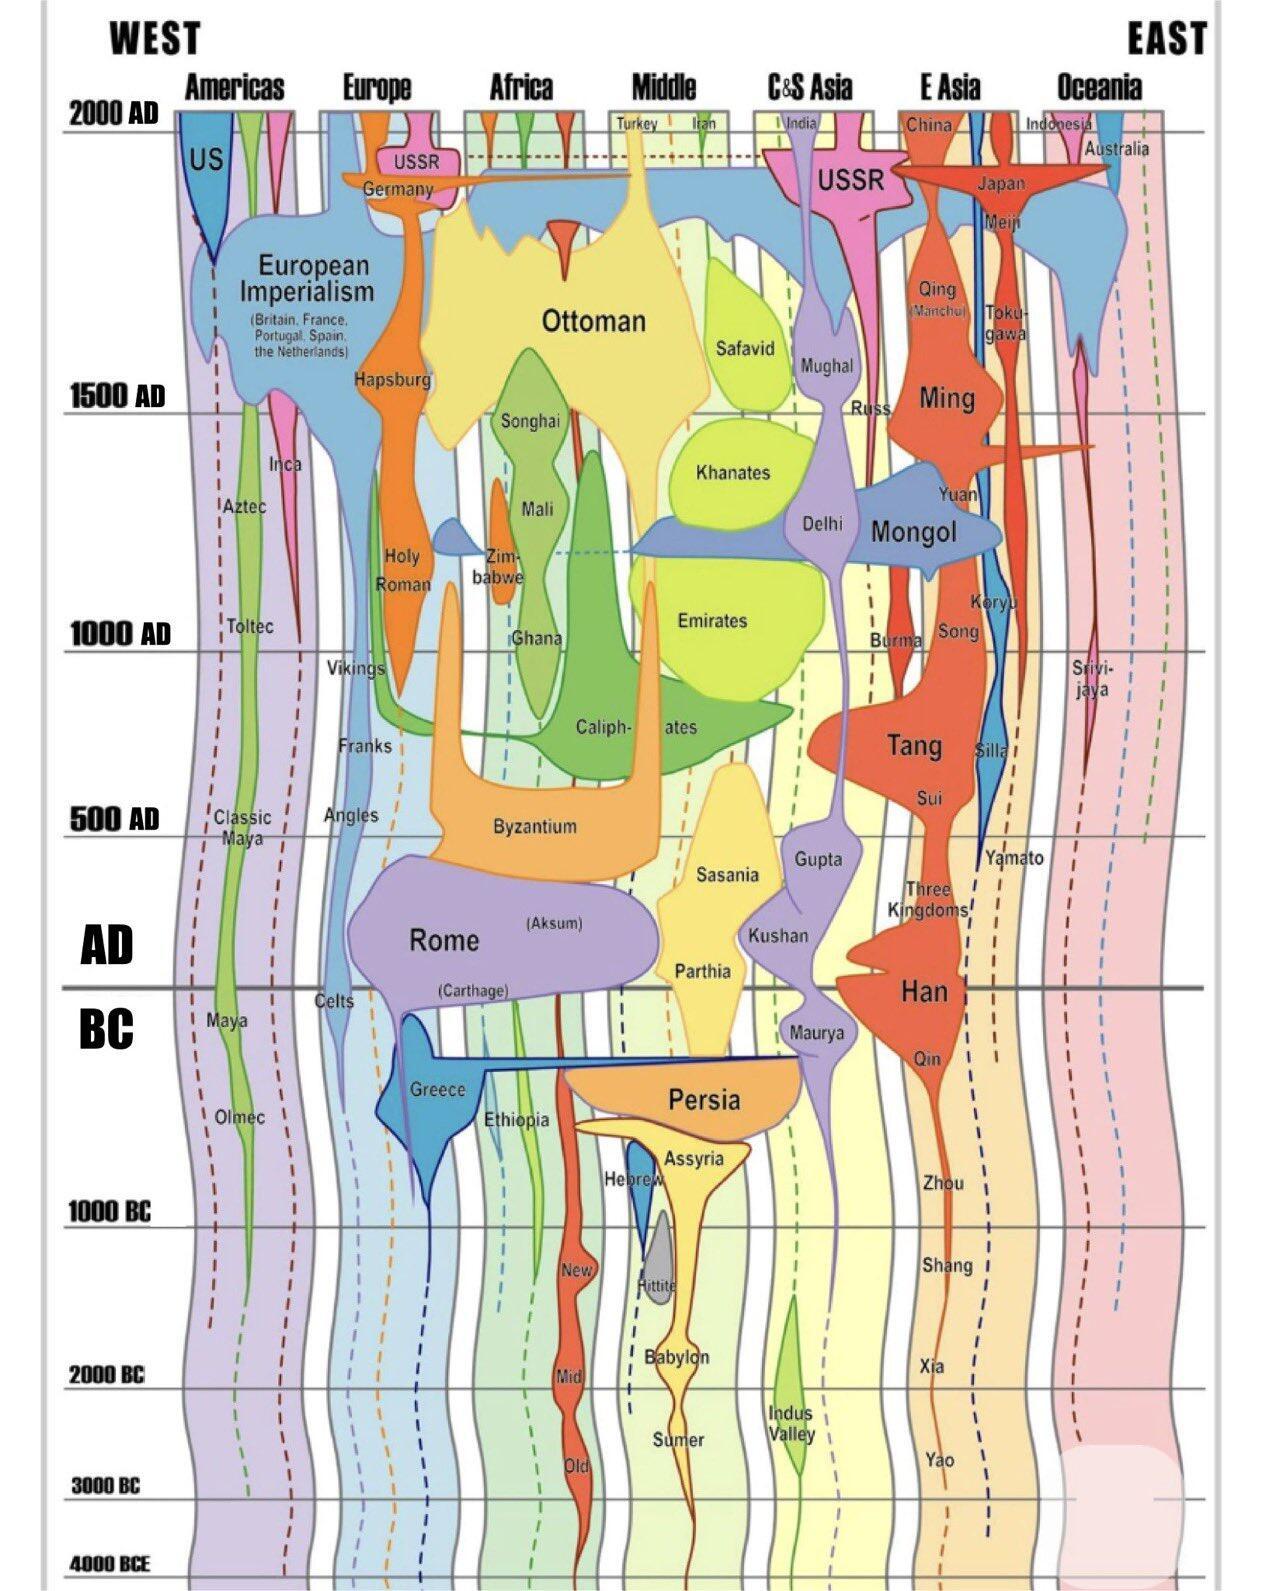
Horizontal Axis (Geography): The world is divided into seven geographical regions, arranged from west to east: Americas, Europe, Africa, Middle East, Central & South Asia, East Asia, and Oceania.
Content Description
The empires and civilizations are represented by colored, flowing shapes that resemble a "violin" or "stream" plot.
Duration: The vertical length of each shape shows the period during which that civilization or empire existed.
Influence: The width of a shape at any given point in time suggests its relative power or geographical extent. Wider sections indicate a peak of influence, while narrow sections show periods of lesser influence, or the beginning/end of the empire.
Interaction: The shapes are placed within their primary geographical region. They sometimes overlap or appear to flow into one another, suggesting succession, conquest, or the splintering of empires.
Historical Timeline of Empires
Here is a walkthrough of the major empires depicted on the chart, moving up through time:
Ancient Period (4000 BCE - 500 AD):
Middle East: The chart begins with early civilizations like Sumer, followed by Babylon, the Hittites, Assyria, and the Hebrews. The large Persian empire emerges around 500 BCE and is a dominant feature.
Africa: Early kingdoms are shown, leading to the rise of Ethiopia (Aksum) and Carthage.
Europe: Early Celtic cultures are noted, followed by the civilizations of Greece and then the vast Roman Empire, which dominates Europe, North Africa, and the Middle East around the year 1 AD.
Asia: The Indus Valley civilization is shown in C&S Asia, followed by the Maurya, Kushan, Gupta, and Sasanian empires. In East Asia, the Xia, Shang, and Zhou dynasties lead to the unified Qin and Han empires.
Americas: The Olmec and Maya civilizations are the earliest shown in this region.
Post-Classical Period (500 AD - 1500 AD):
Europe: After the fall of Rome, the Byzantine Empire continues in the east, while the Franks and Vikings emerge in the west, eventually leading to the Holy Roman Empire.
Middle East & Africa: The Islamic Caliphates expand across the Middle East and North Africa. In West Africa, the empires of Ghana, Mali, and Songhai appear.