Discussion
Loading...

Post

  • About
  • Code of conduct
  • Privacy
  • Users
  • Instances
  • About Bonfire
Emeritus Prof Christopher May
@ChrisMayLA6@zirk.us  ·  activity timestamp 3 weeks ago

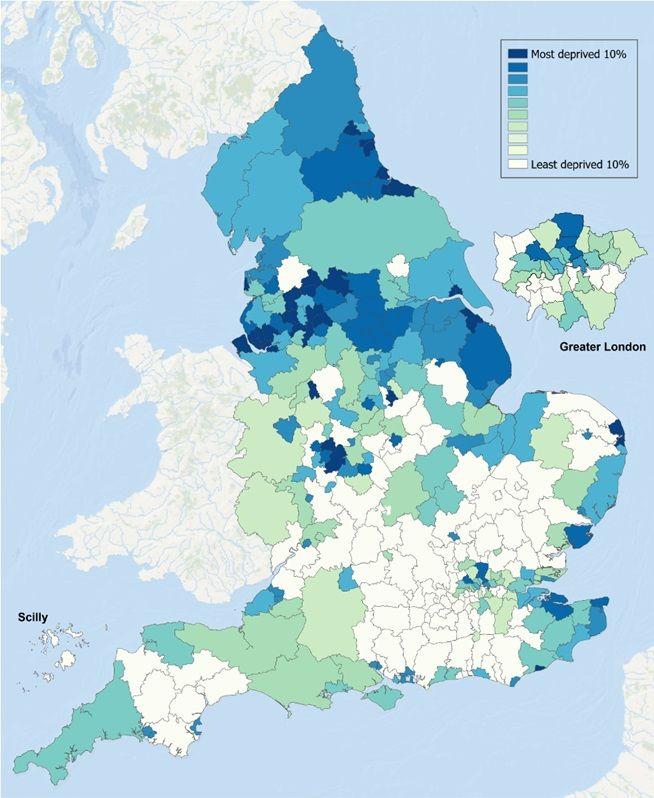
You'll have seen the reports on a new survey of relative deprivation across England; here's a map that sums up the regional dimensions of deprivation.

As many have noted the two key aspects of higher deprivation are living in a run-down seaside locations or being further from London; specifically in the Northern areas of England.

No wonder the political class are myopic about poverty, they just often don't see it or experience it in the everyday lives...

#politics #inequality

h/t LinkedIn

Map showing relative levels of poverty across England by decile. The areas in the bottom 10% (i.e. most deprived) are clustered in a range of coastal areas & in a few locations in the North of England
  • Copy link
  • Flag this post
  • Block
Log in

bonfire.cafe

A space for Bonfire maintainers and contributors to communicate

bonfire.cafe: About · Code of conduct · Privacy · Users · Instances
Bonfire social · 1.0.0 no JS en
Automatic federation enabled
  • Explore
  • About
  • Members
  • Code of Conduct
Home
Login