Discussion
Loading...

Post

  • About
  • Code of conduct
  • Privacy
  • Users
  • Instances
  • About Bonfire
NetBlocks
@netblocks@mastodon.social  ·  activity timestamp 2 weeks ago

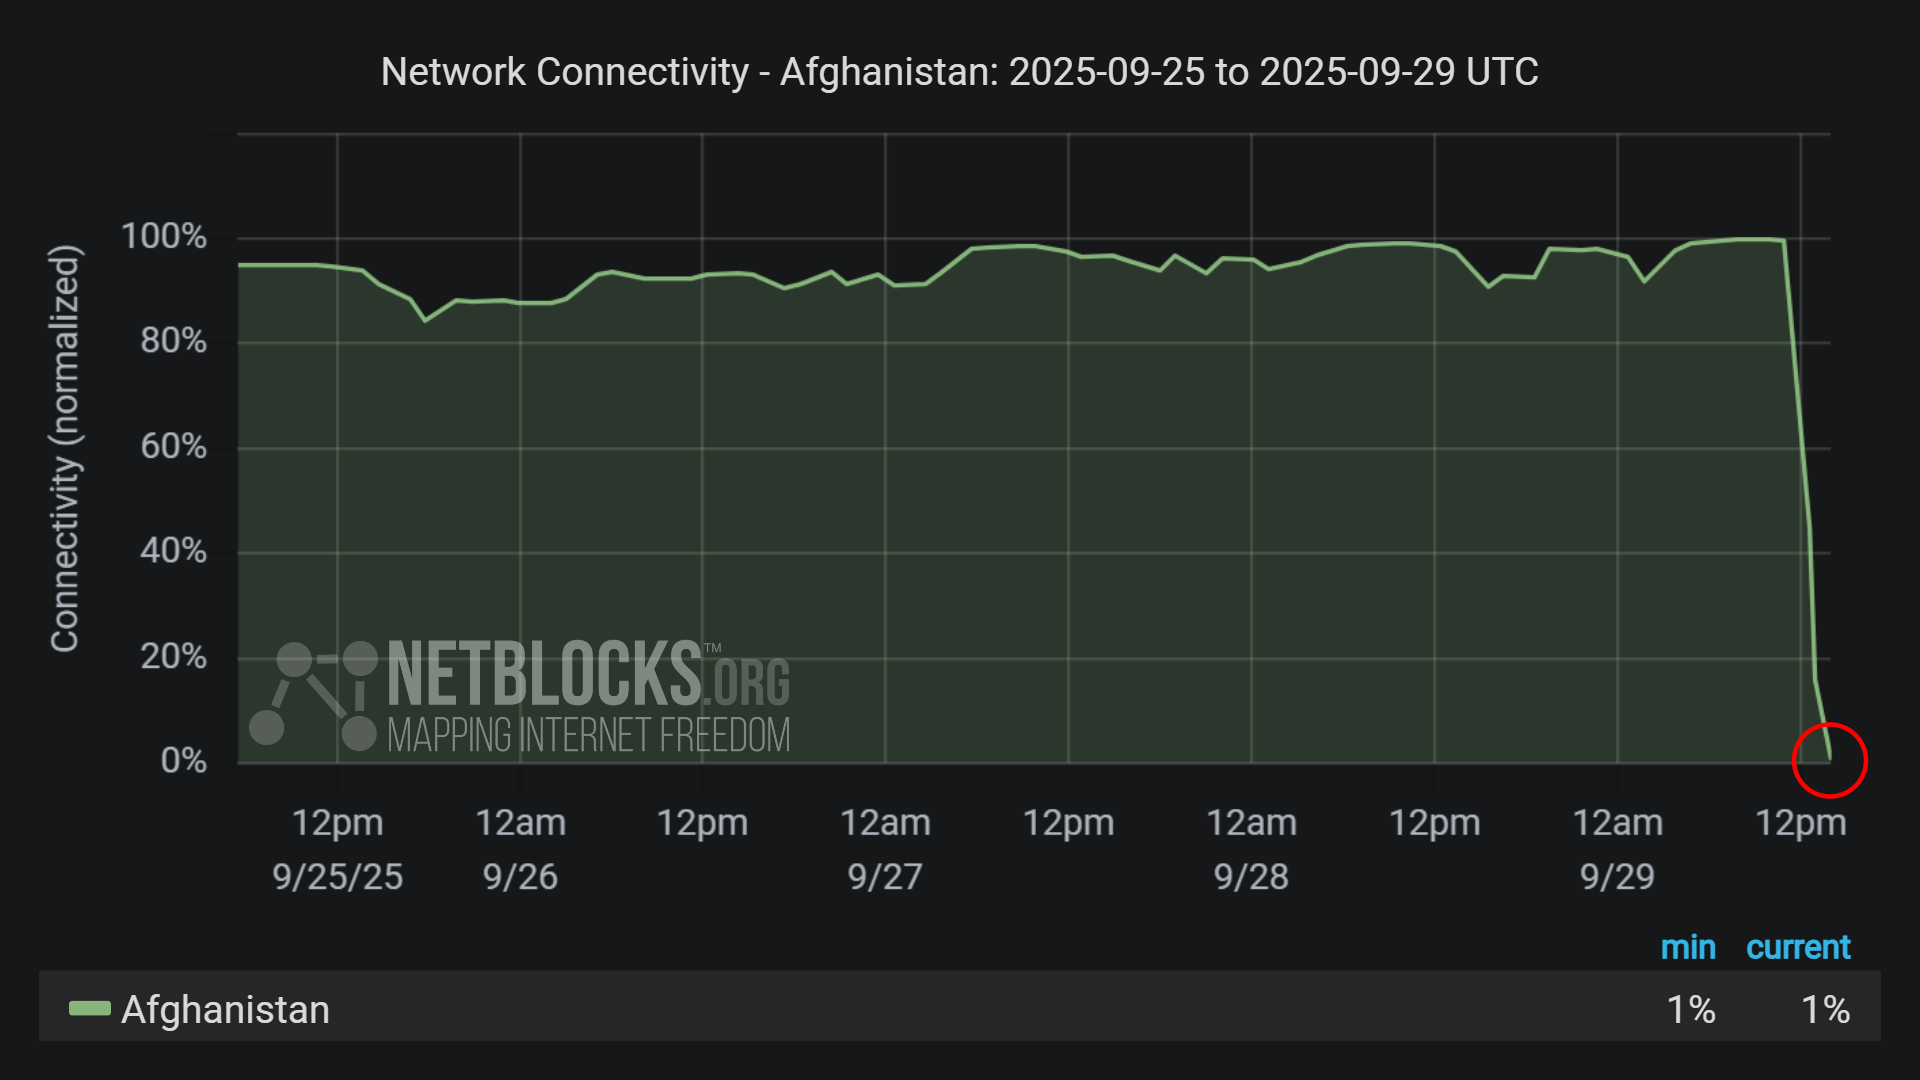
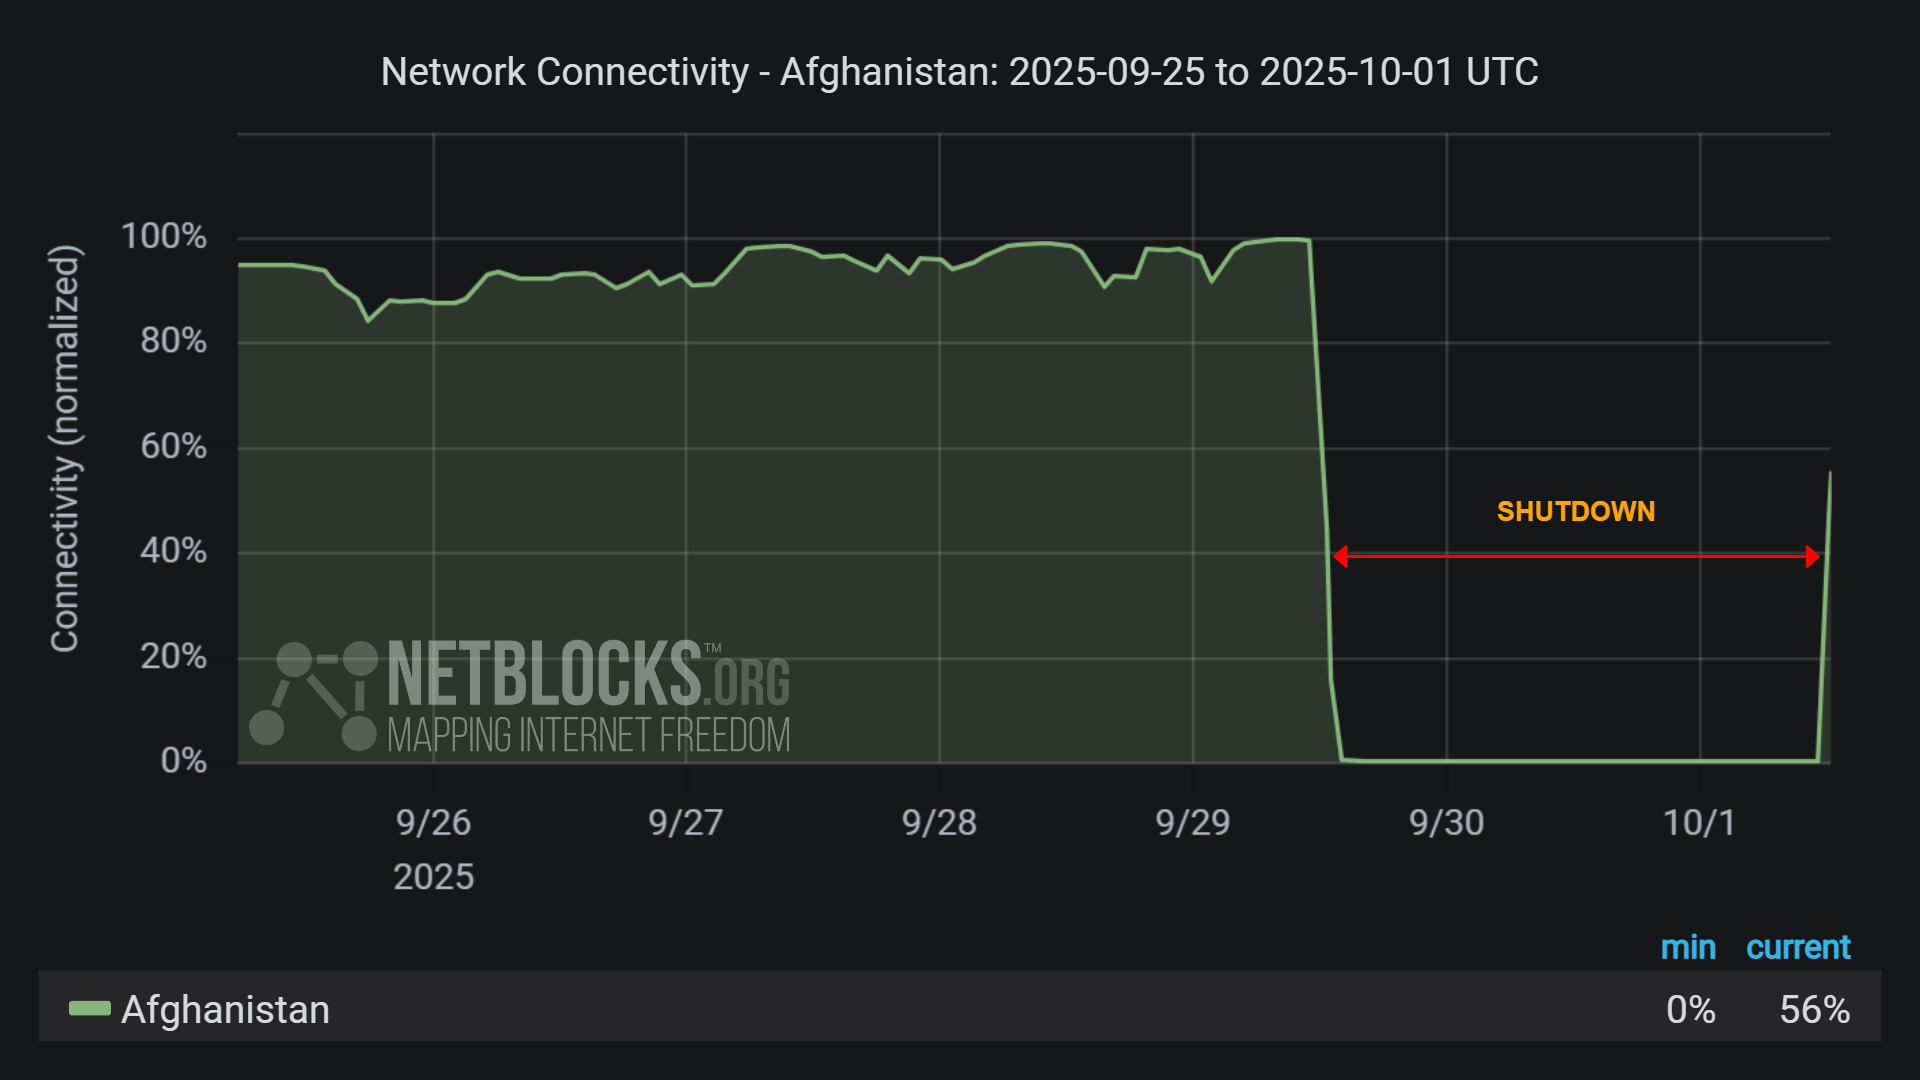
⚠️ Update: #Afghanistan is now in the midst of a total internet blackout as Taliban authorities move to implement morality measures, with multiple networks disconnected through the morning in a stepwise manner; telephone services are currently also impacted

Graph from NetBlocks showing the network connectivity in Afghanistan, from September 25, 2025, to September 29, 2025. The y-axis represents normalized connectivity, ranging from 0% to 100%, and the x-axis represents the dates. The green line representing Afghanistan's connectivity remains stable at around 100% throughout most of the time period, with a sharp drop on the after of September 29. The minimum and current connectivity levels are indicated as 1% and 1%, respectively. The chart has a dark background with a red circle highlighting the decline at the end of the period.
  • Copy link
  • Flag this post
  • Block
NetBlocks
@netblocks@mastodon.social replied  ·  activity timestamp last week

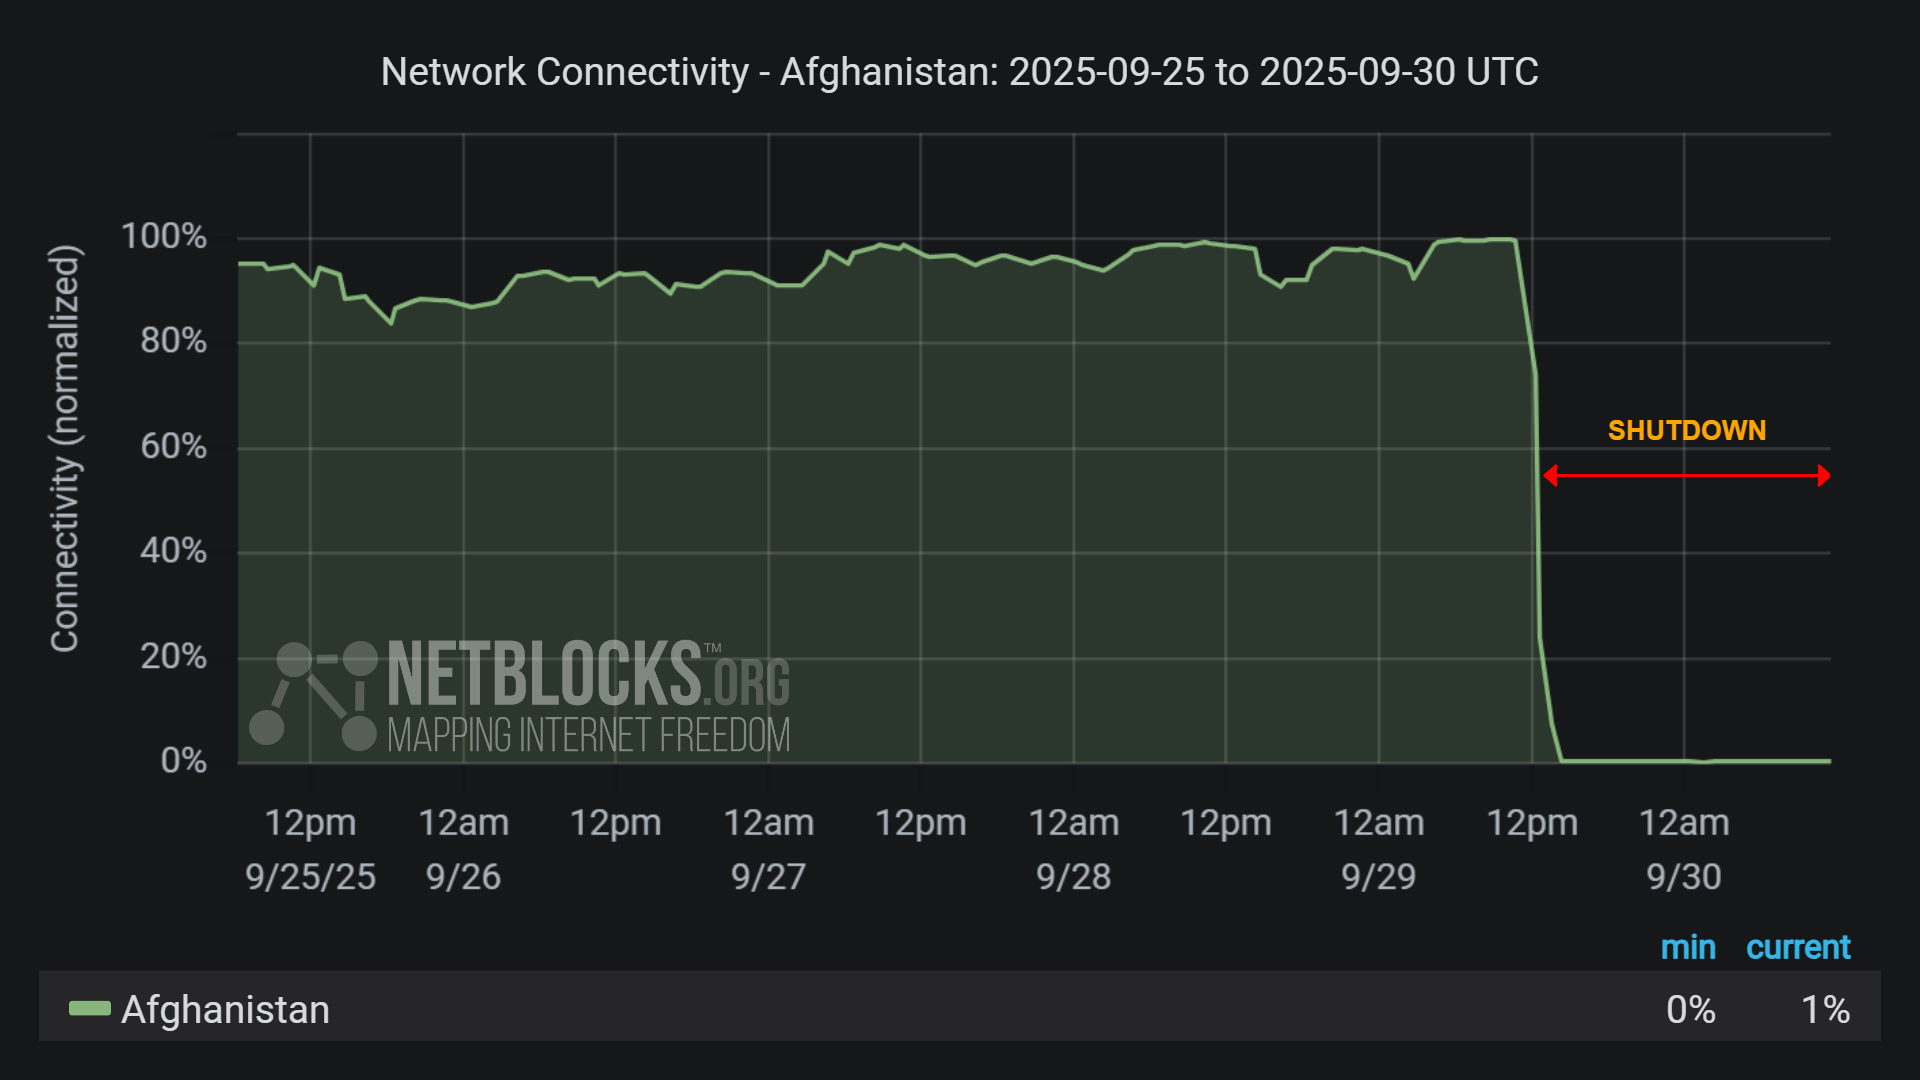
⚠️ Update: It has now been 24 hours since #Afghanistan imposed a national internet blackout, cutting off residents from the rest of the world; the ongoing measure marks the Taliban's return to conservative values it espoused a quarter of a century ago limiting basic freedoms

Graph from NetBlocks showing the network connectivity in Afghanistan, from September 25, 2025, to September 30, 2025. The y-axis represents normalized connectivity, ranging from 0% to 100%, and the x-axis represents the dates. The green line representing Afghanistan's connectivity remains stable at around 100% throughout most of the time period, with a sharp drop on the afternoon of September 29. The minimum and current connectivity levels are indicated as 0% and 1%, respectively. The chart has a dark background with a red horizontal arrow labeled 'SHUTDOWN' indicates the period of disruption.
  • Copy link
  • Flag this comment
  • Block
NetBlocks
@netblocks@mastodon.social replied  ·  activity timestamp last week

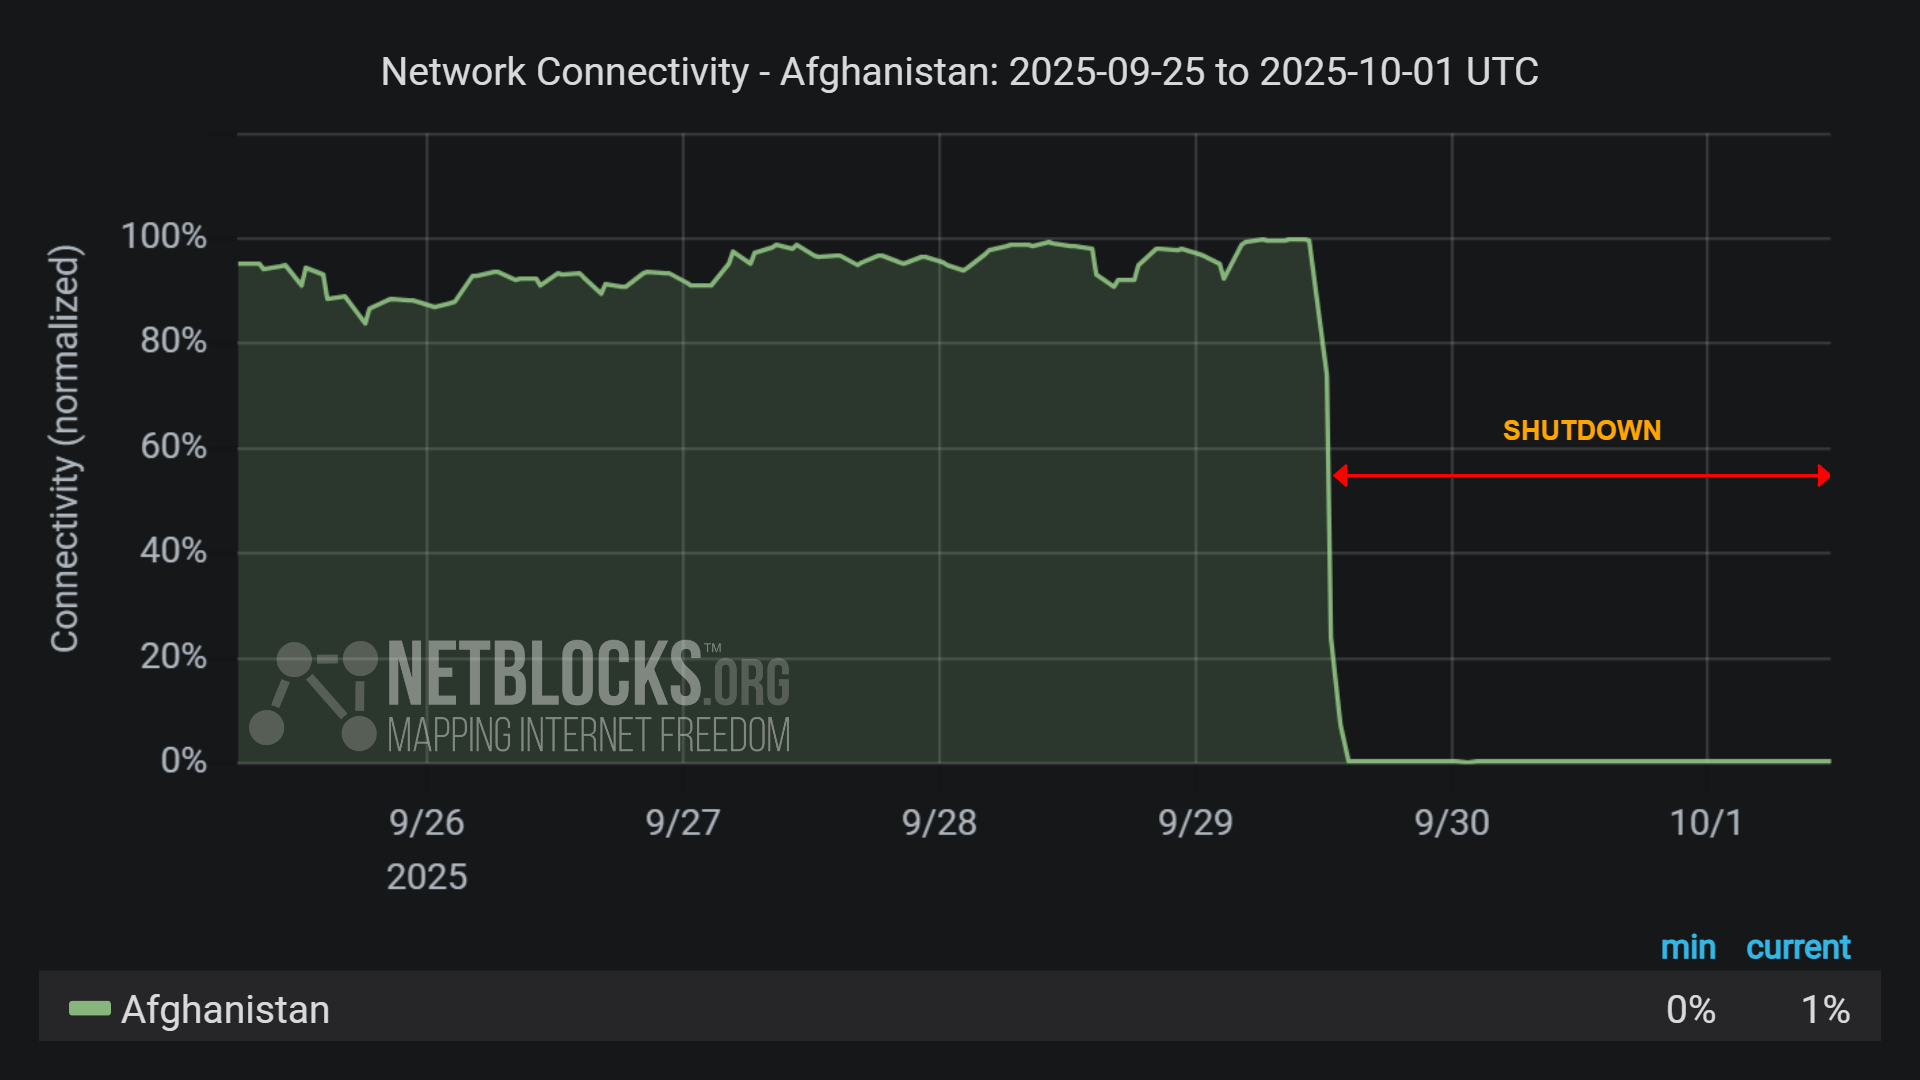
⚠️ Update: Metrics show internet connectivity in #Afghanistan still flatlining 48 hours after the country's disconnection; telemetry confirms Taliban experimentation with various censorship mechanisms in preceding weeks, contradicting their claims of a "fiber replacement" program

Graph from NetBlocks showing the network connectivity in Afghanistan, from September 25, 2025, to October 1, 2025. The y-axis represents normalized connectivity, ranging from 0% to 100%, and the x-axis represents the dates. The green line representing Afghanistan's connectivity remains stable at around 100% throughout most of the time period, with a sharp drop on the afternoon of September 29. The minimum and current connectivity levels are indicated as 0% and 1%, respectively. The chart has a dark background with a red horizontal arrow labeled 'SHUTDOWN' indicates the period of disruption.
  • Copy link
  • Flag this comment
  • Block
NetBlocks
@netblocks@mastodon.social replied  ·  activity timestamp last week

ℹ️ Update: Live network data show the partial restoration of internet connectivity in #Afghanistan amid outcry after a two-day national telecoms blackout; the incident comes as the Taliban leadership applies new "immorality" rules on telco operators

Graph from NetBlocks showing the network connectivity in Afghanistan, from September 25, 2025, to October 1, 2025. The y-axis represents normalized connectivity, ranging from 0% to 100%, and the x-axis represents the dates. The green line representing Afghanistan's connectivity remains stable at around 100% throughout most of the time period, with a sharp drop on the afternoon of September 29. Partial recovery is now visible. The minimum and current connectivity levels are indicated as 0% and 56%, respectively. The chart has a dark background with a red horizontal arrow labeled 'SHUTDOWN' indicates the period of disruption.
  • Copy link
  • Flag this comment
  • Block
Sebastian Lasse
@sl007@digitalcourage.social replied  ·  activity timestamp 2 weeks ago

@netblocks

^ Let us define "morality matters".
#Afghanistan

/ @AuswaertigesAmt
If you consider this a safe space, you need to tell chief Baerbock / UN that you do not accept fundamental human rights nor UN WSIS anymore.
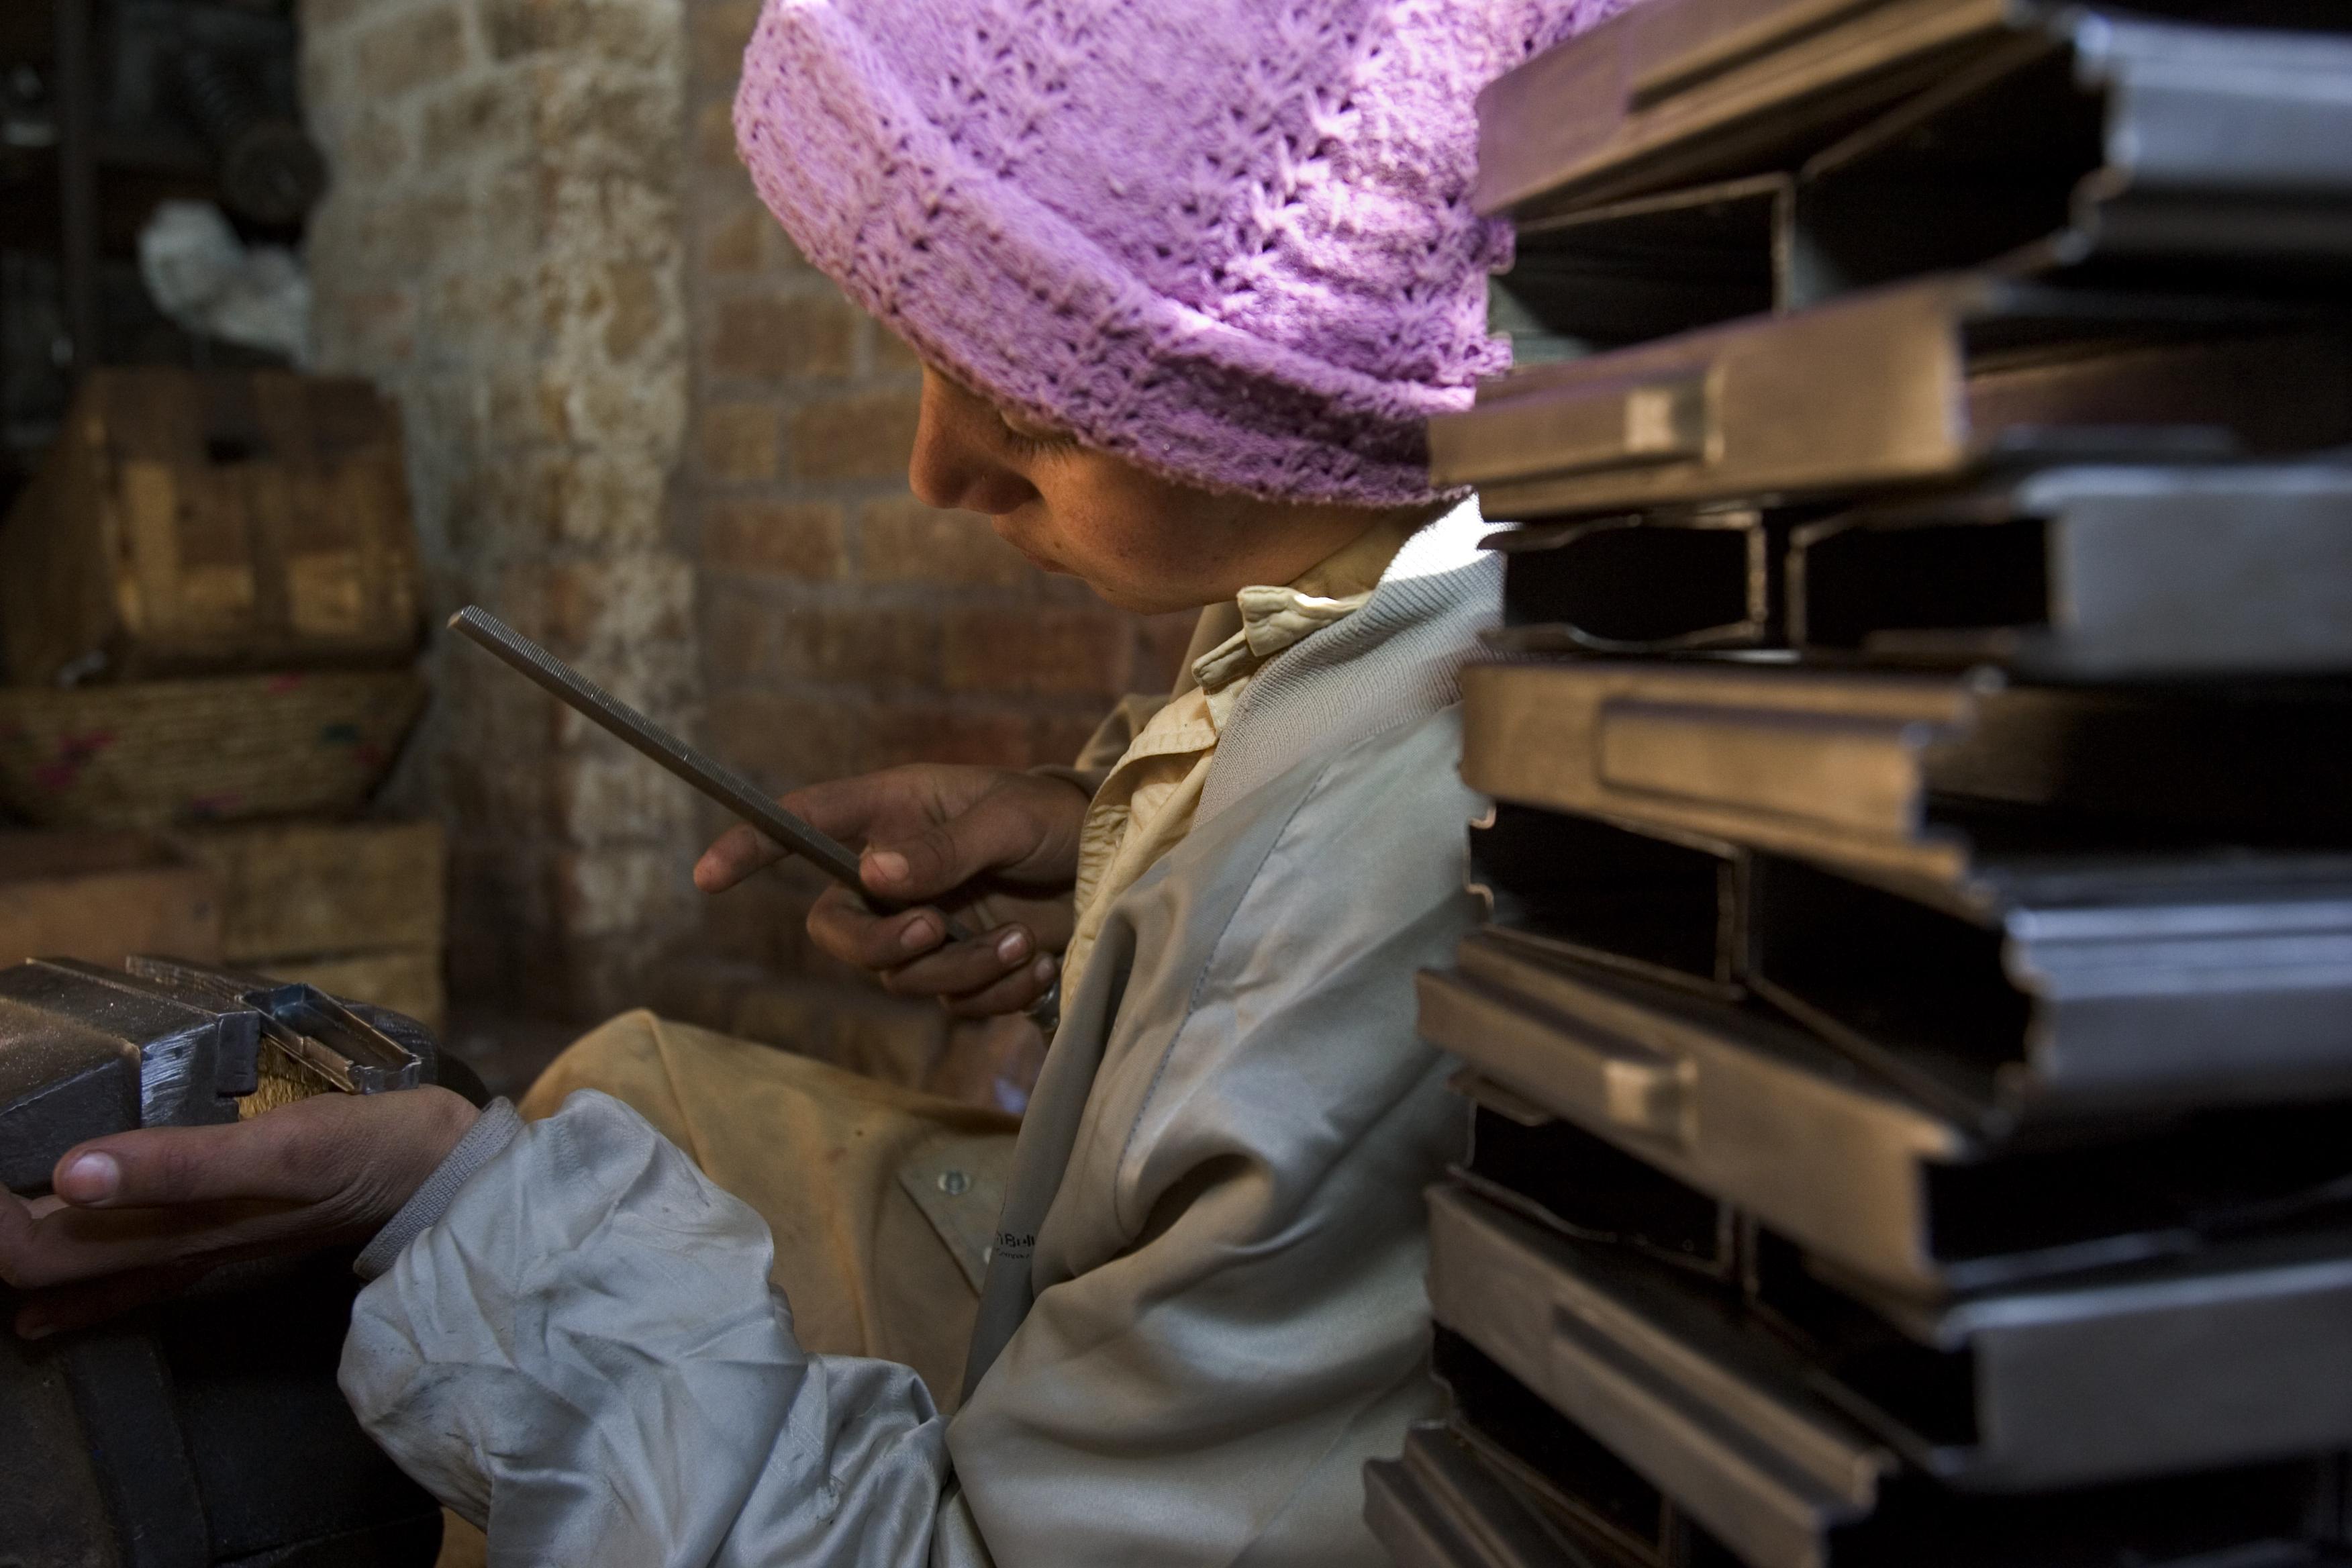
[photo of the child assembling ammunition magazines by me]

A child is assembling shooting magazines in Darra Adam Khel.
  • Copy link
  • Flag this comment
  • Block
Log in

bonfire.cafe

A space for Bonfire maintainers and contributors to communicate

bonfire.cafe: About · Code of conduct · Privacy · Users · Instances
Bonfire social · 1.0.0-rc.3.13 no JS en
Automatic federation enabled
  • Explore
  • About
  • Members
  • Code of Conduct
Home
Login