Discussion
Loading...

Post

  • About
  • Code of conduct
  • Privacy
  • Users
  • Instances
  • About Bonfire
Wim馃М
@wim_v12e@scholar.social  路  activity timestamp 2 months ago

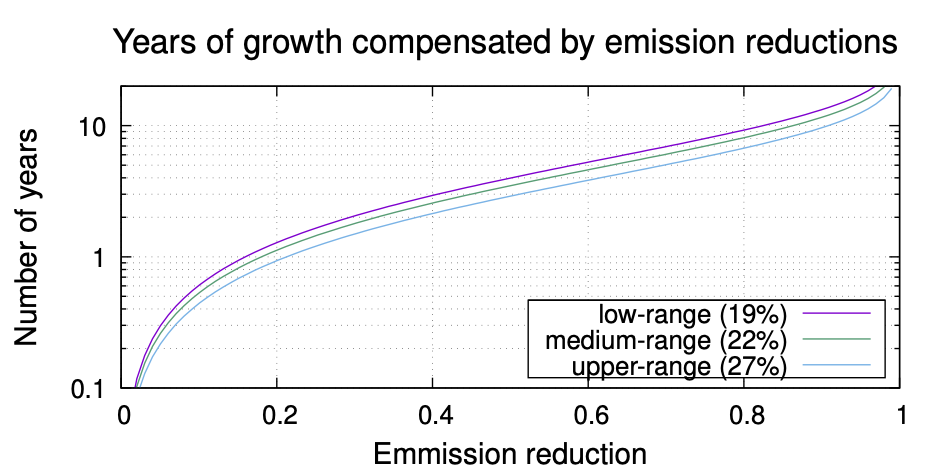
To illustrate this, here is a graph from the paper. It shows the number of years of growth you can compensate through saving of emissions by any means except reducing the growth.
If your savings are <10%, you can compensate a few months. If it's around 50%, you can compensate a few years of growth. To compensate order of 10 years of growth you need to reduce emissions by more than 80%.
(4/4)

#FrugalComputing

A graph titled "Years of growth compensated by emission reductions" with Number of years on the Y axis, log scale, and Emission reduction (a number between 0 and 1) on the X axis. A set of three curves, for 19%, 22% and 27% data centre capacity growth. The curves are steep on the low and high sides and more shallow in the middle.
  • Copy link
  • Flag this post
  • Block
Log in

bonfire.cafe

A space for Bonfire maintainers and contributors to communicate

bonfire.cafe: About 路 Code of conduct 路 Privacy 路 Users 路 Instances
Bonfire social 路 1.0.0 no JS en
Automatic federation enabled
  • Explore
  • About
  • Members
  • Code of Conduct
Home
Login