Discussion
Loading...

Post

Log in
  • About
  • Code of conduct
  • Privacy
  • Users
  • Instances
  • About Bonfire
Lambda :neofox_flag_nb:
@lambda@chaosfurs.social  路  activity timestamp 4 months ago

馃幎 And these points of data make a beautiful line 馃幎

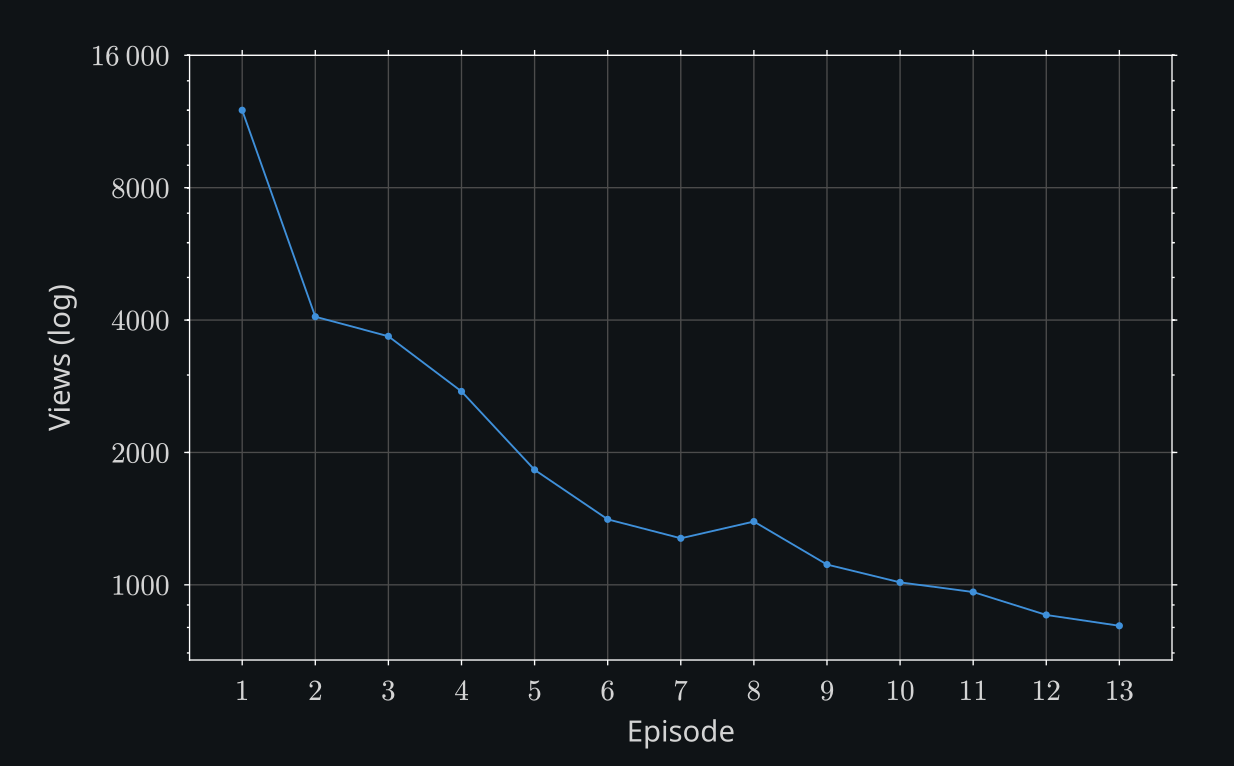
Was a bit bored and decided to plot the view counts of this language learning playlist: https://www.youtube.com/playlist?list=PLJY9CLTbcF4LSmBwzb9NlP292vjSiPoFV. More info in the alt text.

#SignLanguage鈥媠 are not just interesting, but also really useful even for people without any sort of impairment, and being able to learn them online for free is amazing - huge thanks to Atilla Gum, who is currently looking for funding for his studies: https://www.gofundme.com/f/atillagumGU

#脰GS#Geb盲rdenSprache

Line graph of view count (logarithmic scale) by episode number. At 12000 views, the first episode has almost three times as many views as the second episode. After that, the view count follows an almost straight downward-trending line, with the 13th episode at around 800 views.

Because the Y-axis is logarithmic, this means that the views follow an approximately exponential decay, as would be expected from people watching the videos in order from the start, and some percentage of viewers dropping out after each episode.

Plot made using https://lilaq.org/.
Line graph of view count (logarithmic scale) by episode number. At 12000 views, the first episode has almost three times as many views as the second episode. After that, the view count follows an almost straight downward-trending line, with the 13th episode at around 800 views. Because the Y-axis is logarithmic, this means that the views follow an approximately exponential decay, as would be expected from people watching the videos in order from the start, and some percentage of viewers dropping out after each episode. Plot made using https://lilaq.org/.
  • Copy link
  • Flag this post
  • Block

bonfire.cafe

A space for Bonfire maintainers and contributors to communicate

bonfire.cafe: About 路 Code of conduct 路 Privacy 路 Users 路 Instances
Bonfire social 路 1.0.1-alpha.40 no JS en
Automatic federation enabled
Log in
  • Explore
  • About
  • Members
  • Code of Conduct