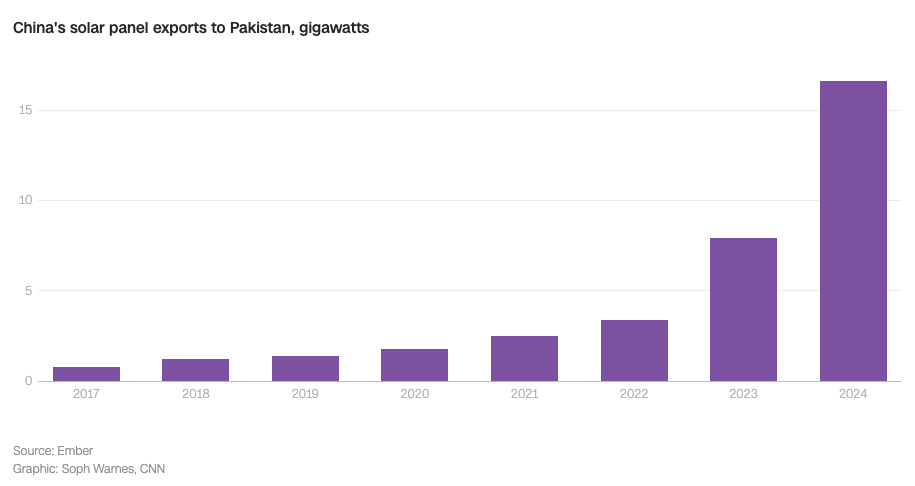
This is a bar chart titled "China's solar panel exports to Pakistan, gigawatts."
The x-axis represents years from 2017 to 2024, and the y-axis represents gigawatts, ranging from 0 to 15.
The data is presented as a series of vertical bars:
2017: The bar is slightly above 0, roughly 0.5 gigawatts.
2018: The bar is just below 1 gigawatt.
2019: The bar is just above 1 gigawatt.
2020: The bar is around 1.5 gigawatts.
2021: The bar is around 2 gigawatts.
2022: The bar is around 3.5 gigawatts.
2023: The bar is around 8 gigawatts.
2024: The bar is over 15 gigawatts, appearing to be the largest bar by a significant margin.
The chart shows a steady, but slow, increase in solar panel exports from China to Pakistan between 2017 and 2022, followed by a dramatic and sharp increase in 2023 and 2024.