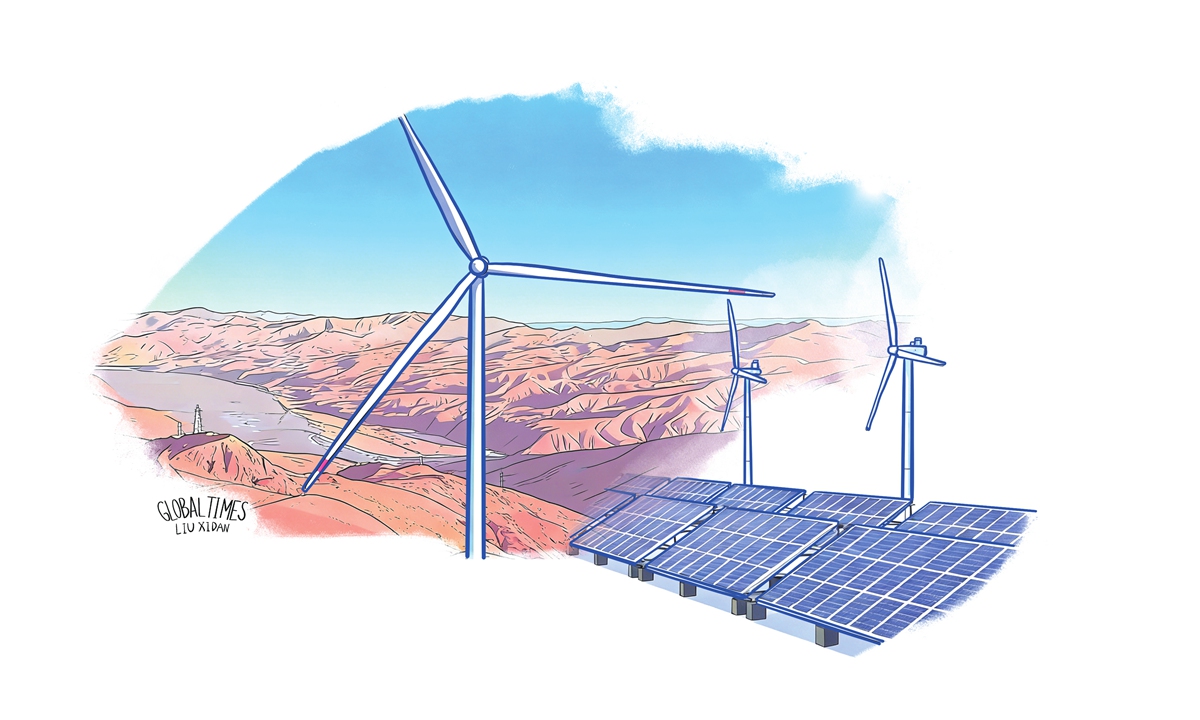
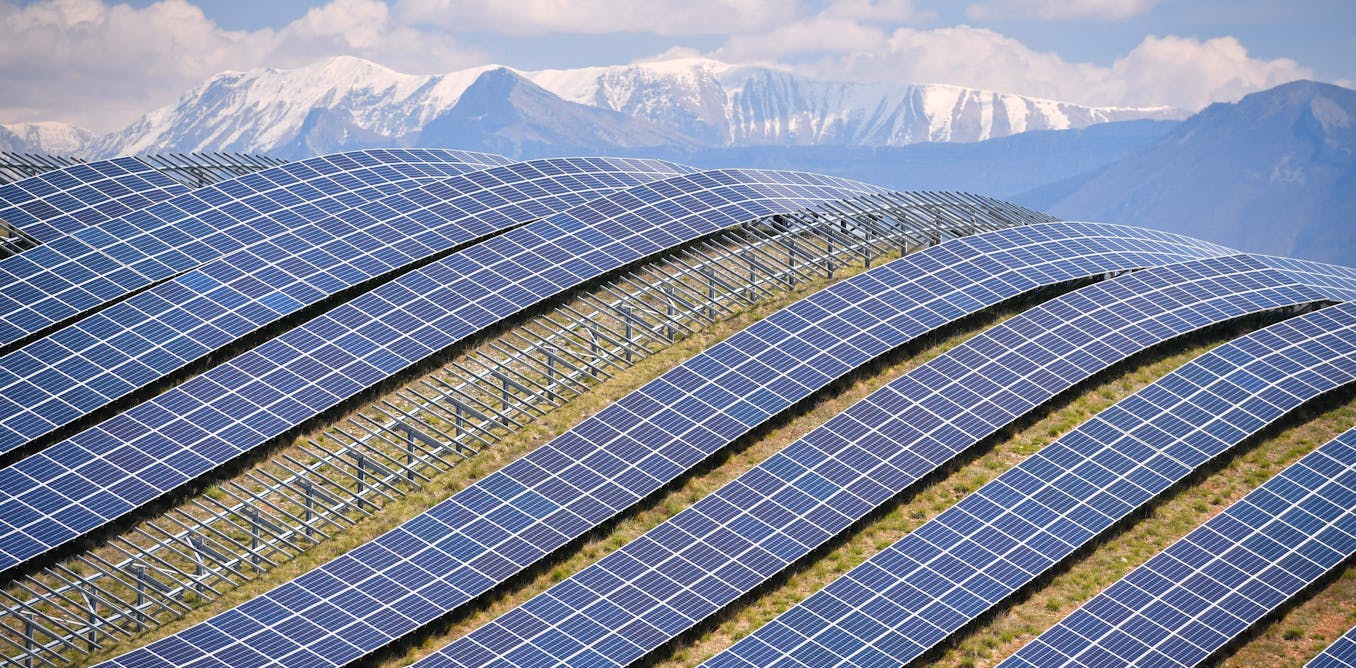
Xinjiang’s new-energy sector unlocks economic gains for region and beyond.
China leads the world in solar power, producing 64% of global utility-scale solar and wind energy. Its massive manufacturing capacity, one terawatt of solar panels annually, has driven costs down to record lows, making solar the cheapest energy source. This boom is transforming global energy markets and posing a major challenge to fossil fuels.
https://futurism.com/science-energy/solar-energy-china-production
⚛️ Weltweit gingen 2025 vier #Atomreaktoren mit 4,4 GW neu ans Netz, 7 Reaktoren mit 2,8 GW wurden stillgelegt. Damit stieg die #AKW-Leistung weltweit nur um 1,6 GW.
☀️ Gleichzeitig wurden jedoch über 650 GW #Photovoltaik neu installiert. Das ist mehr als vierhundert mal so viel!
🤔 Warum reden einige immer noch über eine angebliche Renaissance der #Kernenergie?
https://www.sonnenseite.com/de/energie/globale-atomkraft-bilanz-renaissance-mit-wenig-strahlkraft/
RE: https://mastodon.green/@VQuaschning/115961345024859220
"In 2025, four #nuclear reactors with a capacity of 4.4 GW were connected to the grid in 2025, while seven reactors with a capacity of 2.8 GW were decommissioned. This means that global nuclear power capacity increased by only 1.6 GW last year.
At the same time over _650 GW_ of new #SolarEnergy capacity was installed. That is more than 400 times as much."
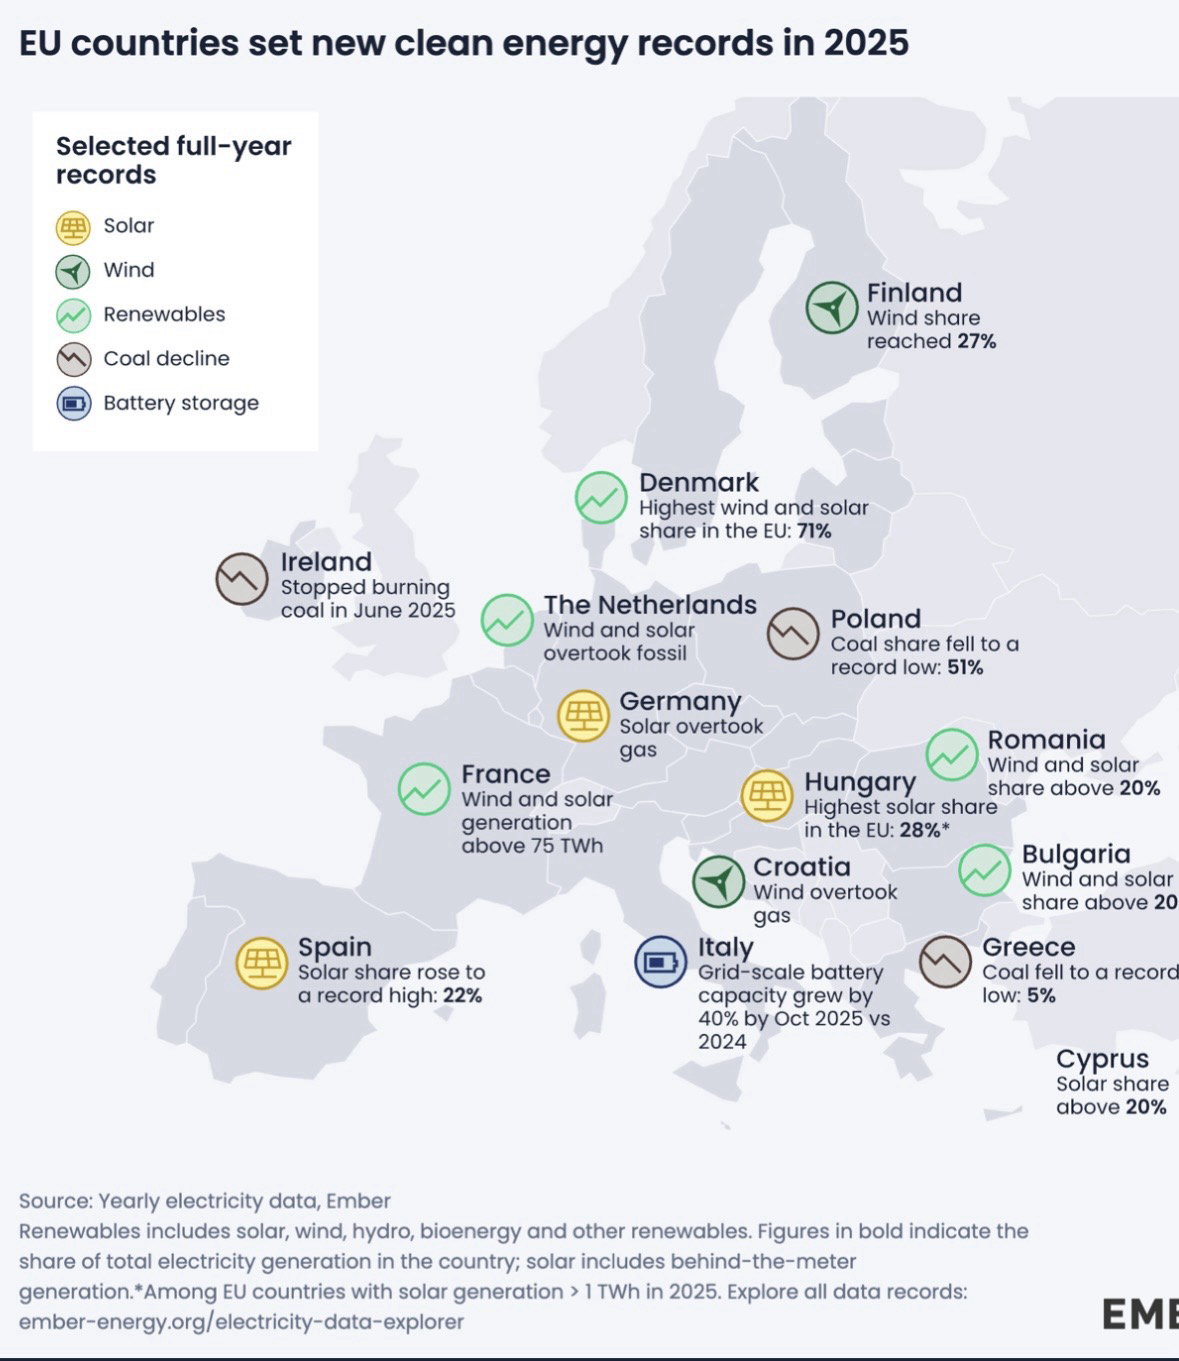
And now something positive:
solar and wind energy production in the EU surpasses fossil energy for the first time.
☀️ 💨
Source: https://dr.dk
@claesdevreese Yes, indeed good news! For the source of this information go to https://ember-energy.org/app/uploads/2026/01/EMBER-Report-European-Electricity-Review-2026.pdf Many more interesting facts and graphs on #cleanenergy can be found here. #ClimateChange #sustainability #ember #EuropeanUnion
China's green revolution is a runaway train. Its solar industry now produces 1 terawatt of panels annually or around 10% of the world's total power capacity. It's electrifying everything from Pakistani homes to global transport, making clean power the cheapest in history.
China's electric surge is decisively solving energy poverty and fossil dependence at a pace no one can fully control.
https://www.wired.com/story/china-renewable-energy-revolution/ (https://archive.ph/xUGxp)
The U.S., under Trump, is aggressively pursuing foreign oil for future dominance. Meanwhile, China is decisively winning the future by electrifying everything. It now produces more electricity than the U.S. and EU combined, leads in EVs, batteries, and rare-earth magnets, and is using its manufacturing might to reshape global technology away from fossil fuels, leaving a fossil-focused America behind.
https://www.nytimes.com/2026/01/19/opinion/trump-energy-china-future.html
Major breakthrough from Korea: Scientists have transformed completely transparent glass into functional solar panels! ☀️🔬
This technology could revolutionize urban energy—turning every window in office buildings, homes, and skyscrapers into electricity generators without blocking views. Building-integrated photovoltaics (BIPV) taken to the next level. Transparent solar glass represents a massive leap for renewable.
#Solar #Innovation #Korea #RenewableEnergy #GreenTech #Science #CleanEnergy #BIPV
US electricity demand surged in 2025 – solar handled 61% of it
https://electrek.co/2026/01/16/us-electricity-demand-surged-in-2025-solar-handled-61-percent/
#HackerNews #USElectricityDemand #SolarEnergy #RenewableEnergy #CleanEnergy #Sustainability
UK offshore wind prices come in 40% cheaper than gas in record auction
https://electrek.co/2026/01/14/uk-offshore-wind-record-auction/
#HackerNews #UKWindEnergy #OffshoreWind #RenewableEnergy #EnergyAuction #CleanEnergy
Coal power is finally retreating in the world’s two largest markets. For the first time since 1973, both China and India saw coal generation drop in 2025 thanks to a relentless clean energy boom. We are witnessing the beginning of the end for the coal era.
#climateaction #renewables #coaldecline #cleanenergy #coal #fossilfuels
https://www.theguardian.com/business/2026/jan/13/coal-power-generation-falls-china-india-since-1970s
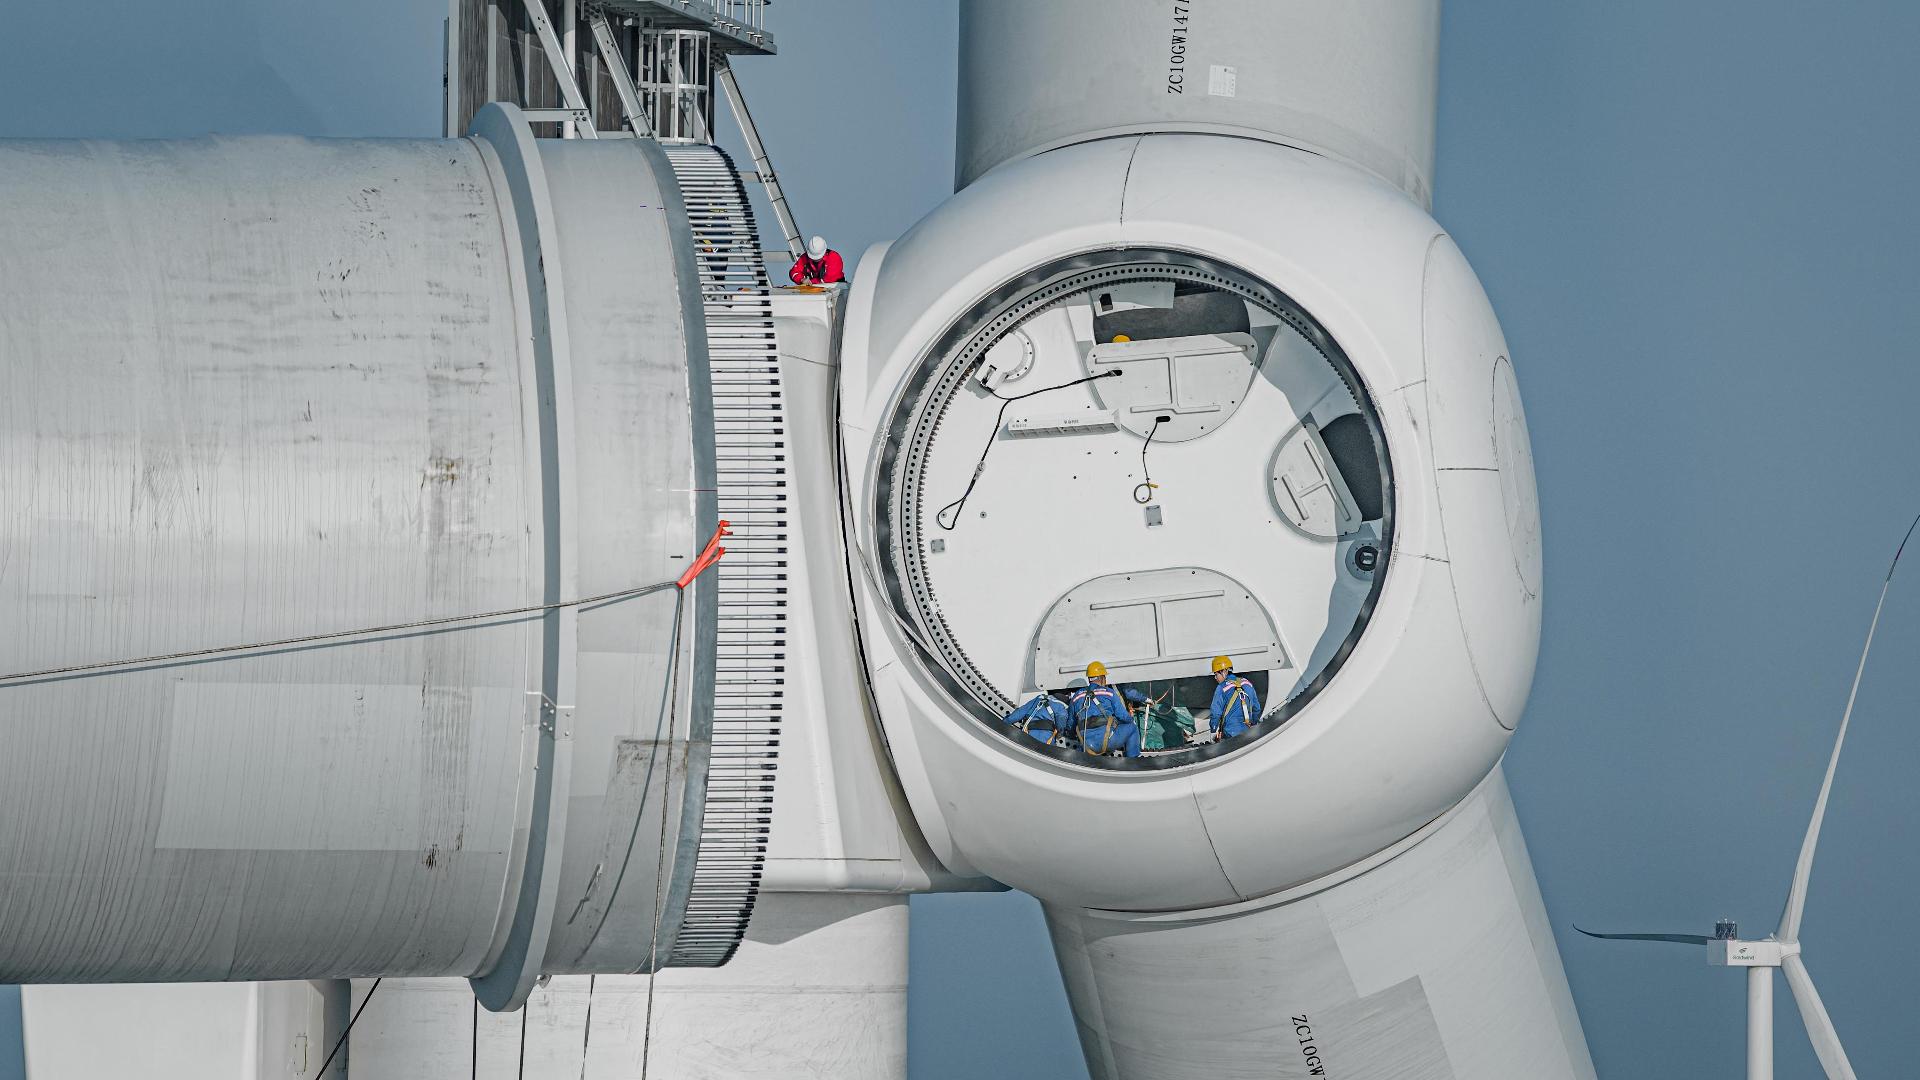
China installs the world's first 20-megawatt offshore wind turbine. The turbine can generate enough electricity to power about 44,000 homes.
Chinese scientists have broken a key fusion barrier, achieving stable plasma density beyond the theoretical Greenwald Limit. This breakthrough in their "artificial Sun" reactor could pave a scalable path to practical, high-output fusion energy.
https://www.independent.co.uk/tech/nuclear-fusion-china-artificial-sun-b2896015.html
China is building one of the most advanced fusion reactors on Earth—a facility that could generate nearly limitless clean energy.
Renewable energy is growing rapidly, but fossil fuel production is also expanding. At COP30, over 80 countries supported Brazil’s call for a formal "road map" to phase out fossil fuels, but oil-producing nations blocked it. The US is pushing to keep fossil fuels dominant. Electro-states are betting on clean energy while petro-states are resisting the transition.
