Discussion
Loading...

Post

  • About
  • Code of conduct
  • Privacy
  • Users
  • Instances
  • About Bonfire
Yogthos
@yogthos@social.marxist.network  ·  activity timestamp last month

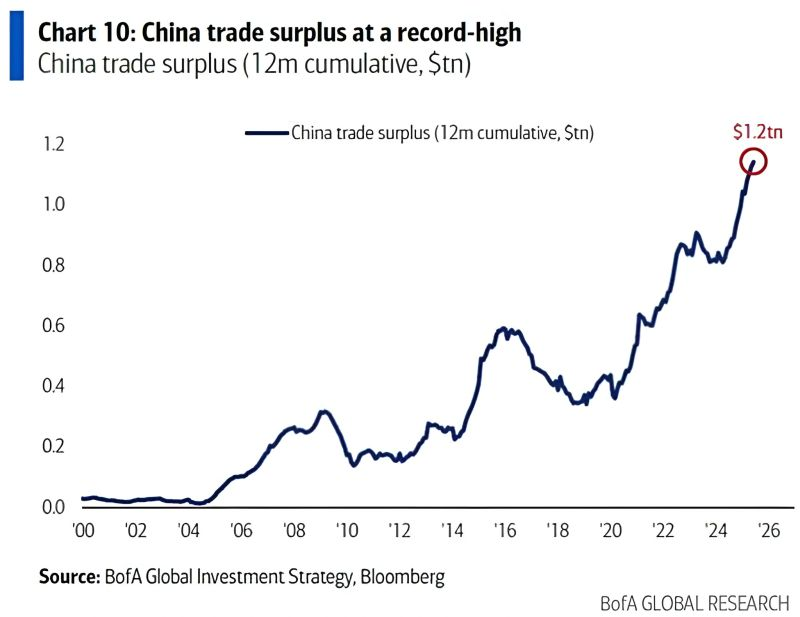
China’s exports have significantly rebounded, excluding the US, with trade surplus hitting a new record high of $1.2 trillion over the past year.

China is expanding global trade as countries flock to it in face of US tariffs.

If one of the objectives of Trump's trade war was to constrain China's global trade dominance, the results are in, and it has failed dramatically. In fact, if anything, it probably had the opposite effect.

https://datatrack.trendforce.com/blog/content/43491/chinas-trade-surplus-breaks-world-record-in-first-half-of-2025-amid-us-tariff-challenges

#usa #china #economics #tradewar

Chart 10: China Trade Surplus Hits Record High

Data Type: 12-month cumulative trade surplus (in $USD trillion)
Source: BofA Global Investment Strategy, Bloomberg
Key Data Points:

    Current Record Surplus: $1.2 trillion (highest point on chart)

    Trend: Steady upward trajectory (visualized from $0.0tn to $1.2tn)

Visual Description:

The bar/line chart shows China’s trade surplus growing over time, peaking at $1.2 trillion. The y-axis ranges from $0.0tn to $1.2tn, with incremental labels at $0.2tn intervals.
Chart 10: China Trade Surplus Hits Record High Data Type: 12-month cumulative trade surplus (in $USD trillion) Source: BofA Global Investment Strategy, Bloomberg Key Data Points: Current Record Surplus: $1.2 trillion (highest point on chart) Trend: Steady upward trajectory (visualized from $0.0tn to $1.2tn) Visual Description: The bar/line chart shows China’s trade surplus growing over time, peaking at $1.2 trillion. The y-axis ranges from $0.0tn to $1.2tn, with incremental labels at $0.2tn intervals.
  • Copy link
  • Flag this post
  • Block
Log in

bonfire.cafe

A space for Bonfire maintainers and contributors to communicate

bonfire.cafe: About · Code of conduct · Privacy · Users · Instances
Bonfire social · 1.0.0-rc.2.21 no JS en
Automatic federation enabled
  • Explore
  • About
  • Members
  • Code of Conduct
Home
Login