Perhaps the biggest highlight of today's run up through the Ōtautahi Port Hills was just how many more korimako (NZ bellbirds) there are about now compared with when I started doing this survey.
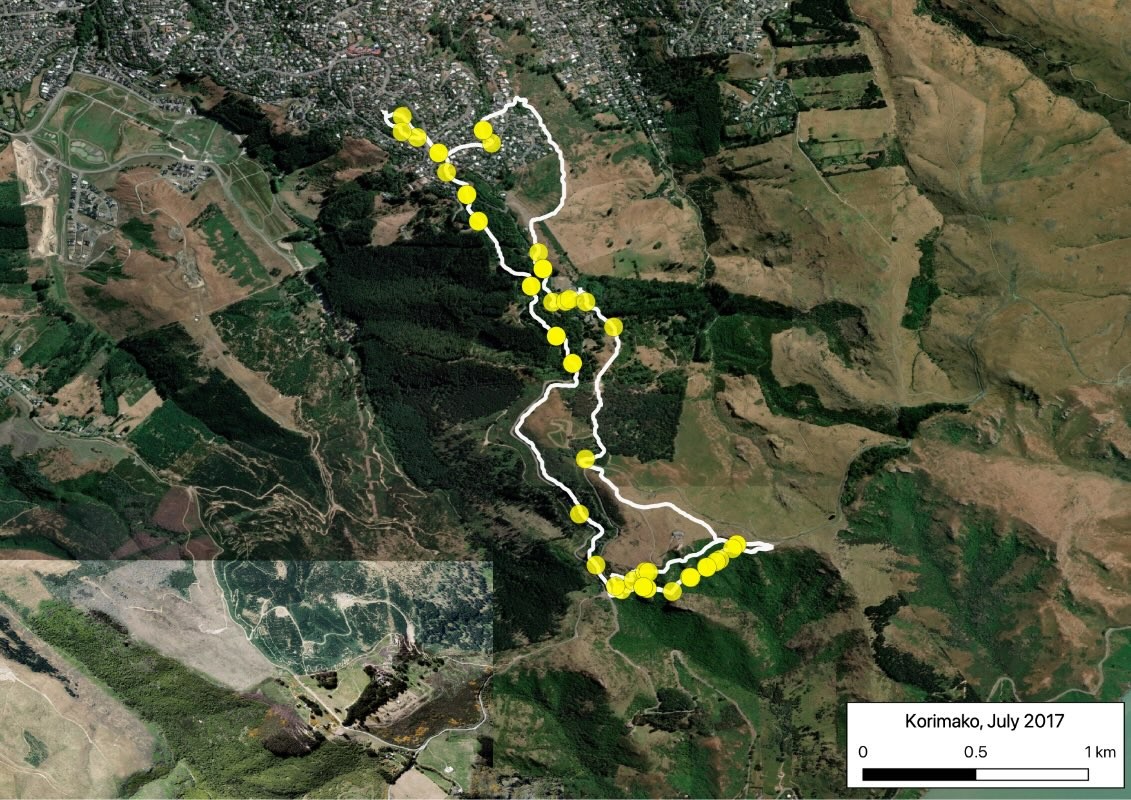
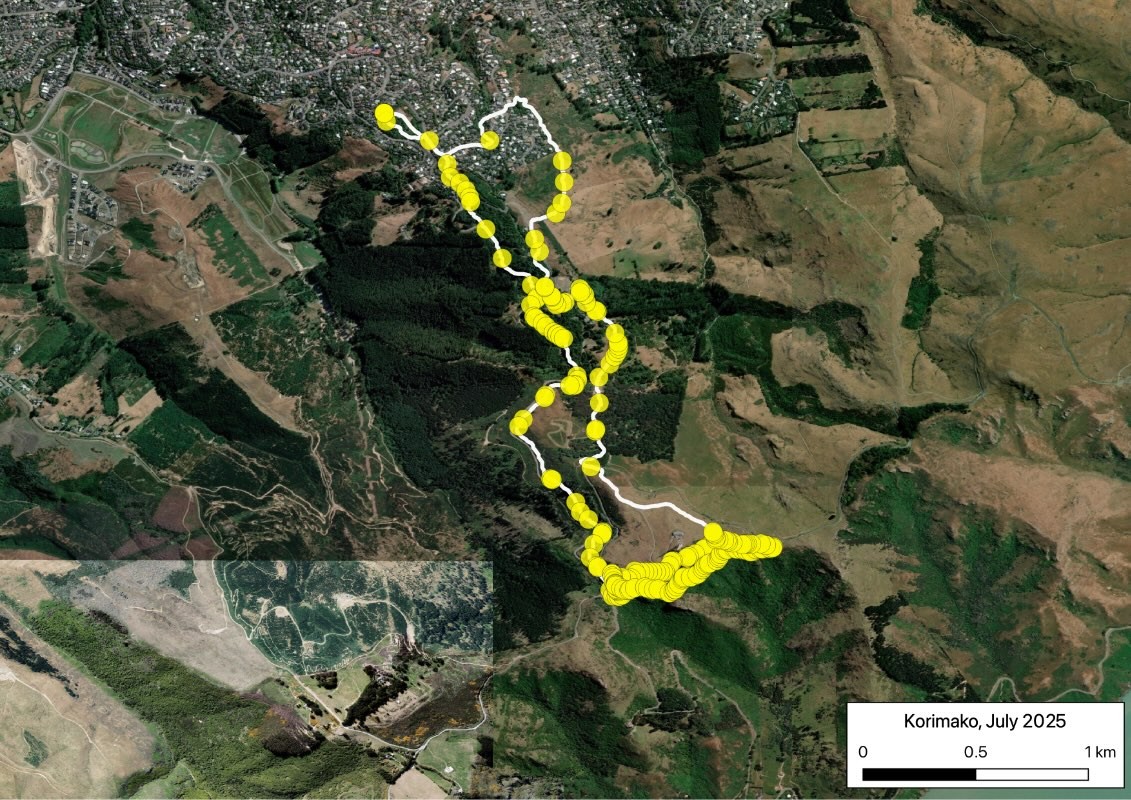
I just checked and on my July 2017 run, I made 54 korimako observations. Today, on the same route, I made 249(!). That's just the mapped points. Some of today's observations were of about 50 birds singing at once.
Check out the two maps to see the big difference.
Huge credit here goes to the City Council Port Hills rangers and the volunteers of the Summit Road Society. Both groups have been helping the native forest to regenerate and have been controlling the pest mammals that eat the birds. It's working!
#UrbanEcology #EcologicalMonitoring #birds #nz#Christchurch #map#ChristchurchCityCouncil#SummitRoadSociety