tools for commensality 🧿
boosted

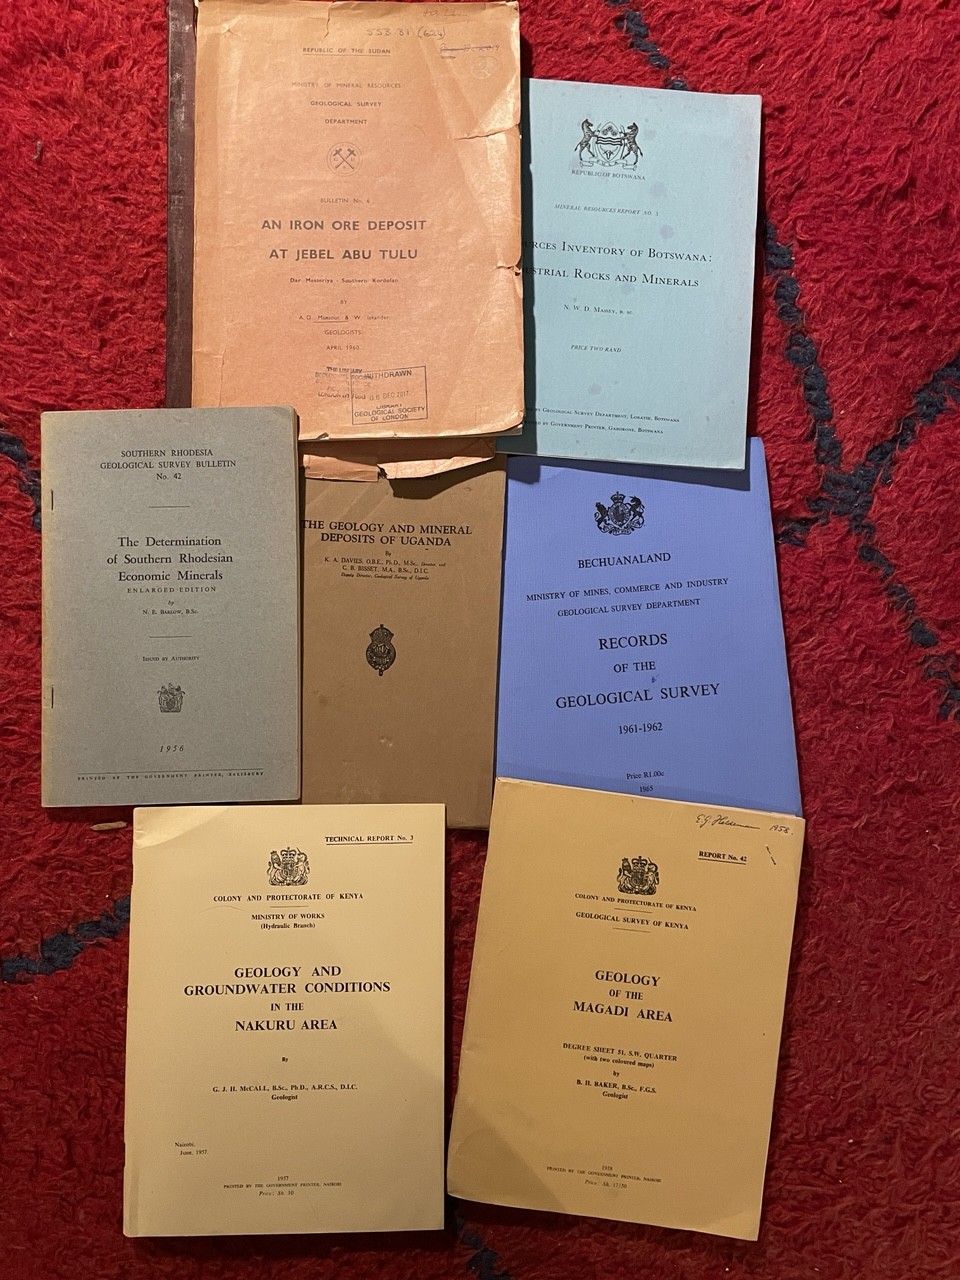
Mother lode of #colonial #geological survey documents just dropped on the doormat today.
#Tag
Mother lode of #colonial #geological survey documents just dropped on the doormat today.
Mother lode of #colonial #geological survey documents just dropped on the doormat today.
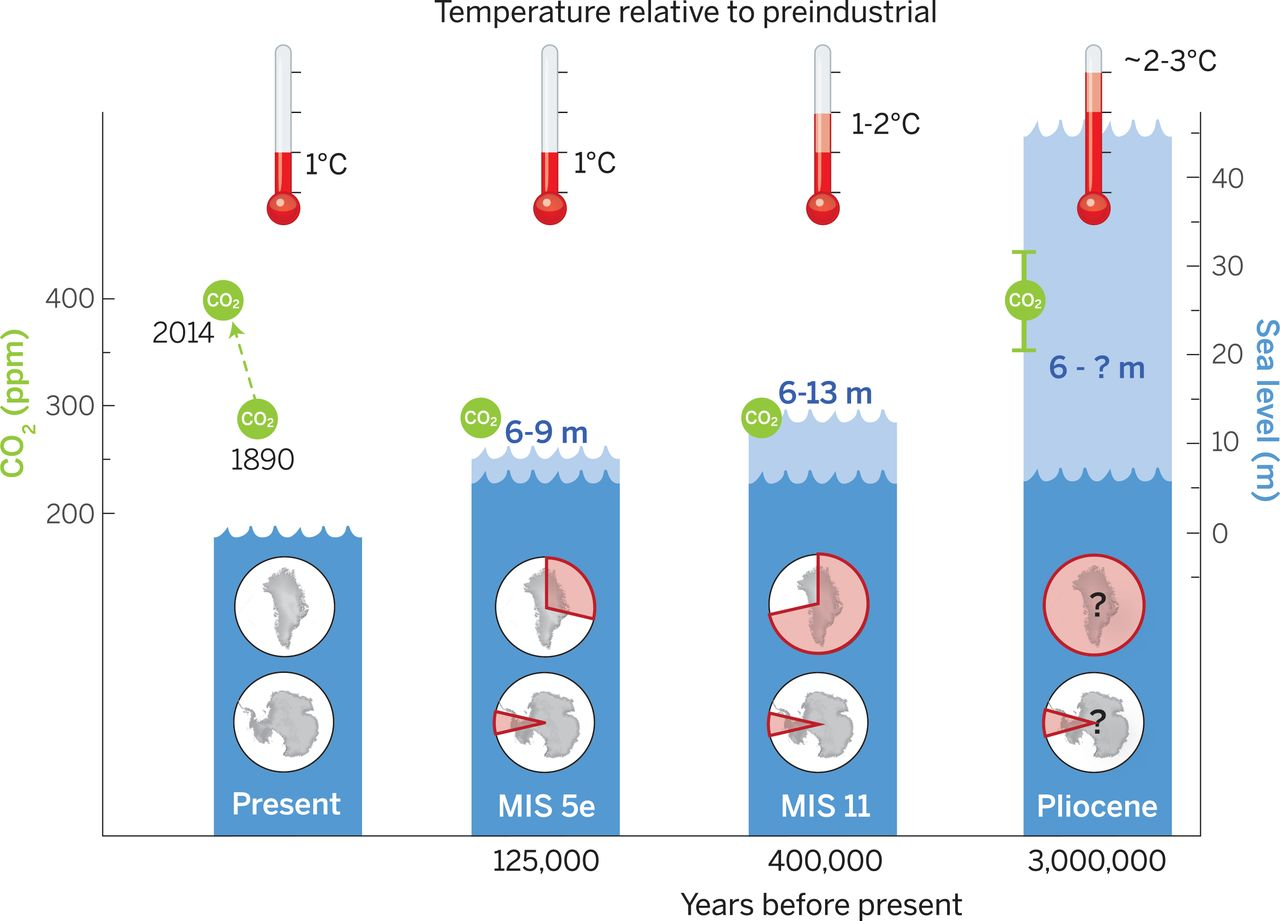
We talk a lot about #sea level rise due to #warming and ice melt. That it's not just based on models. We have a robust #geological record of ice melt events to talk about this with relative confidence*.
* Science speak for "we're fairly sure"
Link: https://www.science.org/doi/full/10.1126/science.aaa4019