
graphics editor at Scientific American • previously at National Geographic • author of Building Science Graphics • https://www.buildingsciencegraphics.com/ #InfoDesign #SciComm #DataViz

Data Editor, NBC News. Into spreadsheets, years-long music playlist projects, using code creatively, and a good story. https://joemurph.bsky.social over there. #DataViz #RainChat #NYC #accessibility
@joemurph.bsky.social

Moving over to mastodon.social. Thank you to vis.social for hosting me!
Slowly going out on a limb. Making experimental creative tools on the web at https://constraint.systems. Lately interested in computer customization in the form of tiling window managers, Linux, and custom keyboards.

Making lanterns & glowies with LEDs, wood, lasers, microcontrollers, vectors, radios.
Erstwhile festival installation artist, DJ & music-maker; old generative art head (pixels, polygons, shaders).
Cofounder/CTO at regrid.com where we put maps & land data online
California, he/him
Light at night researcher at #GFZ Potsdam and Ruhr Uni Bochum. #CitizenScience #LightPollution
Indie product designer, author of Mastering Collaboration, artist, I love music. She/her. Was @gretared on the bird site. @ Oakland, CA

Lecturer in Critical Infrastructure Studies at King’s College London. Cofounder Public Data Lab. Researcher, Digital Methods Initiative + médialab, Sciences Po.
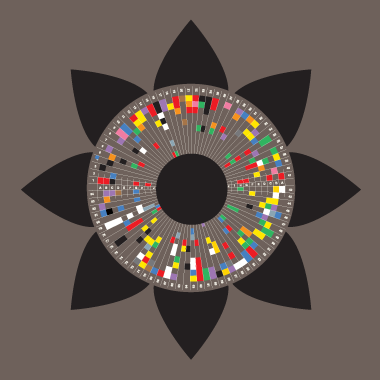
Data visualizations & information graphics by David McCandless. Plus favourite finds from around the web. Making sense of the world - well, trying to - since 2009.
Check out @beautifulnews for positive trends & stats
#InformationIsBeautiful #KnowledgeIsBeautiful #DataViz #iiblive #davidmccandless

typing free software to free the shoulders of giants from golden handcuffs
used to patch people's pants (https://pantsbuild.org) at twitter, now threading every codebase together with spack (https://spack.io) so you can focus on writing code
they/them
That's all folks...