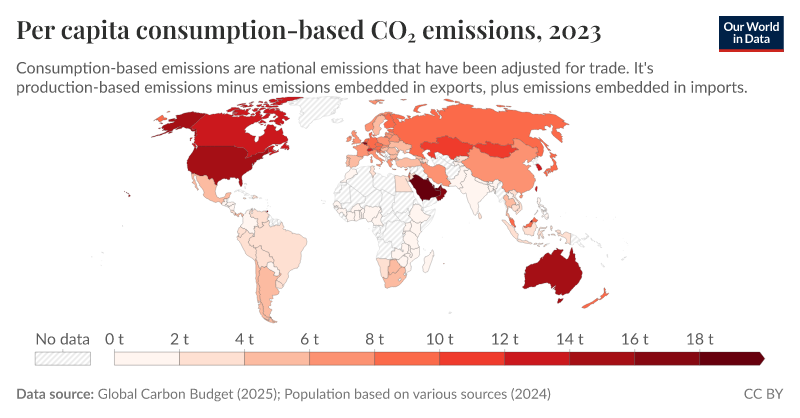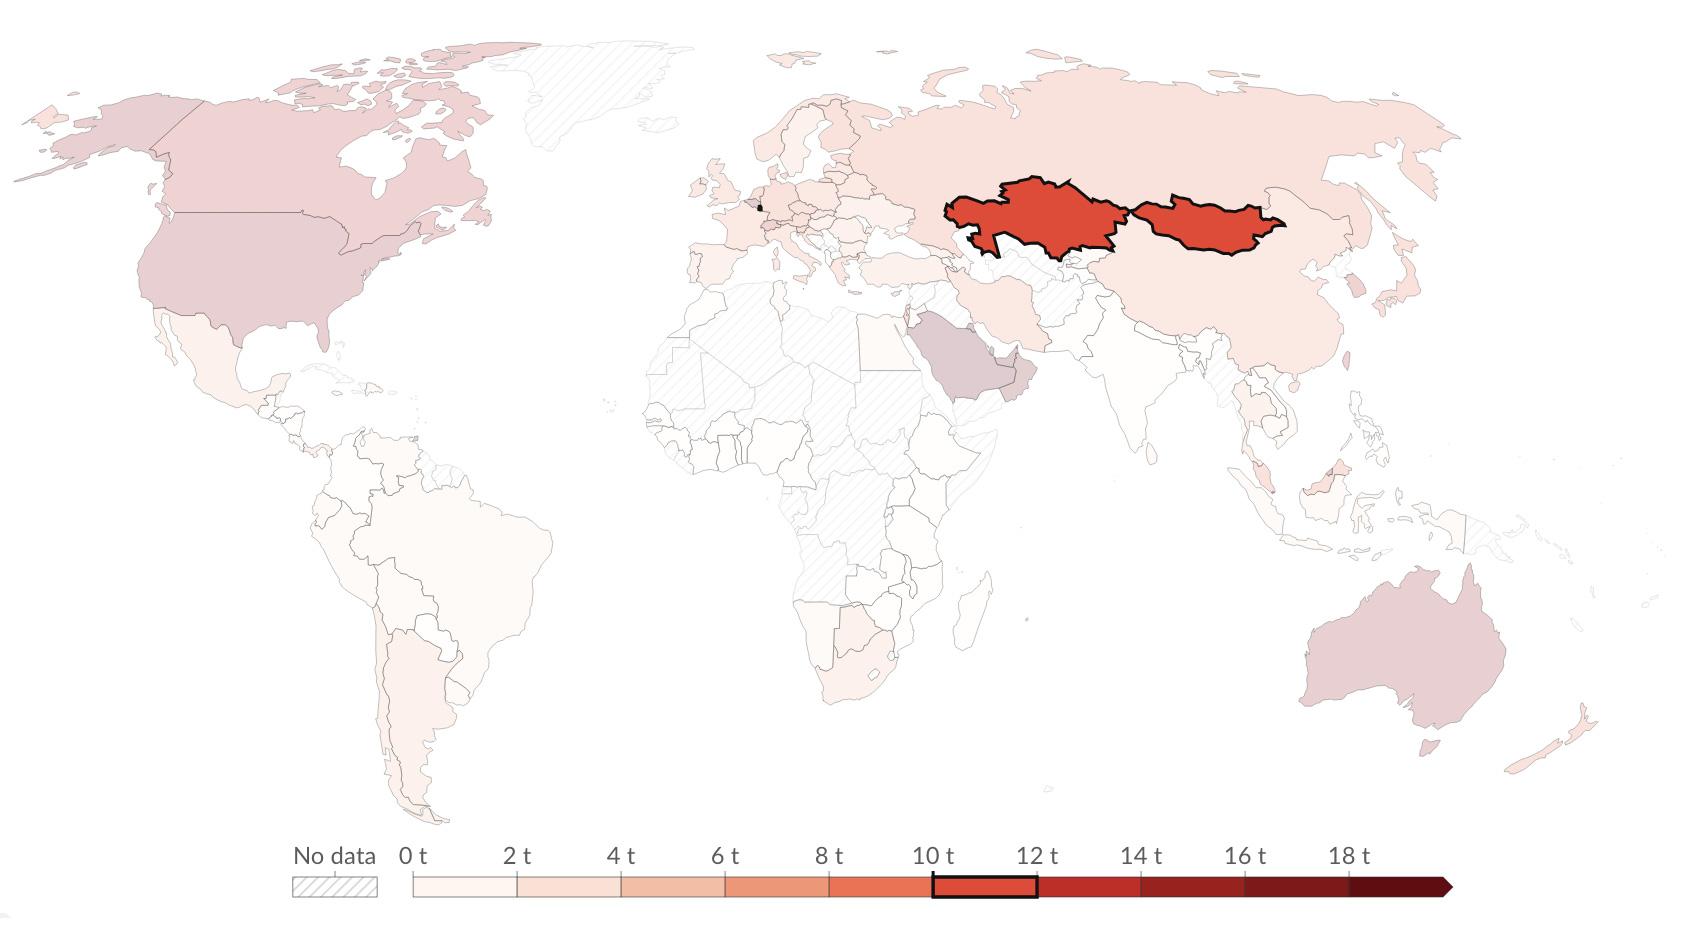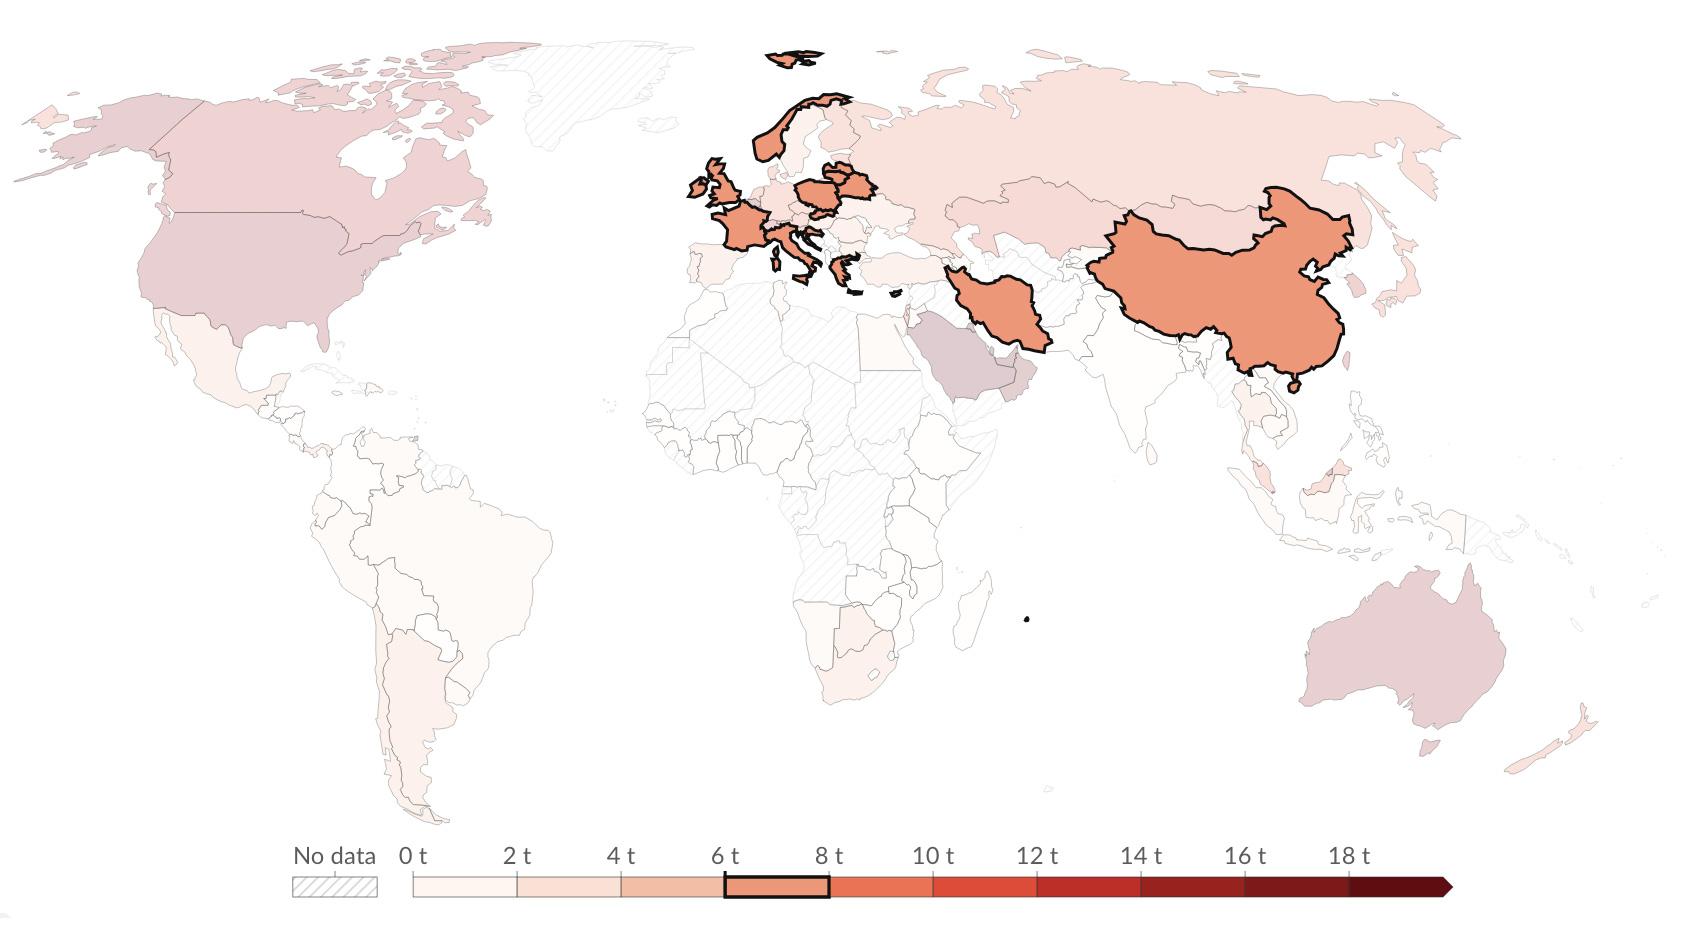

OWiD have a world map of graded *per capita* consumption-based CO2 emissions: “national emissions that have been adjusted for trade – production-based emissions minus emissions embedded in exports, plus emissions embedded in imports”.
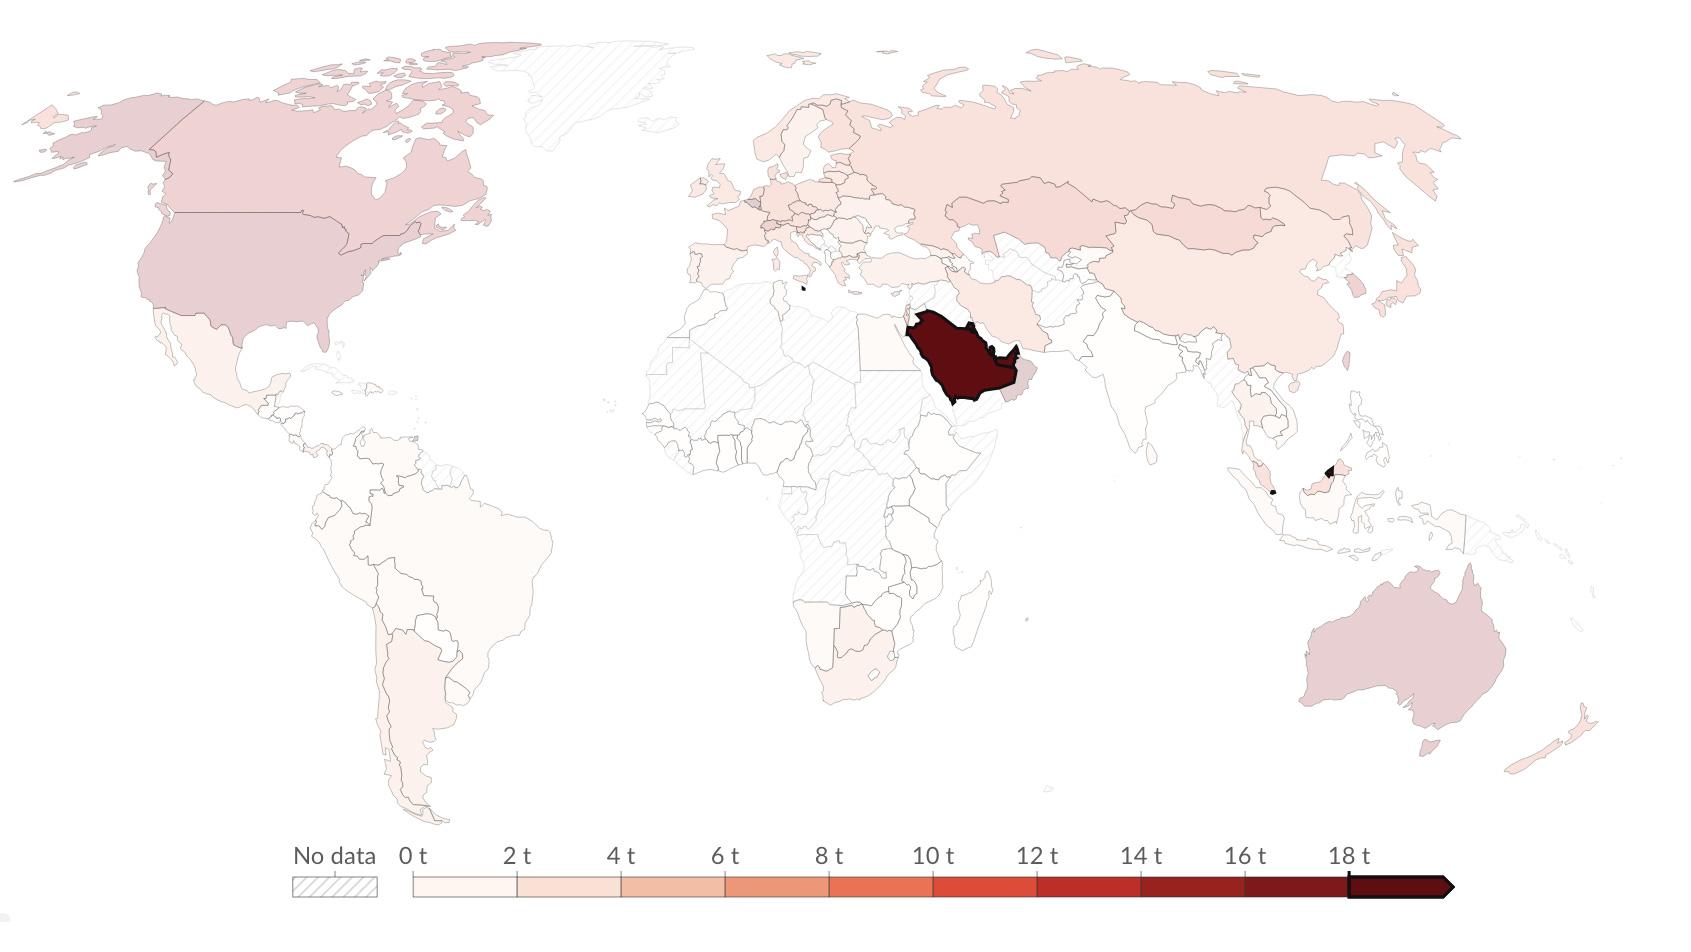
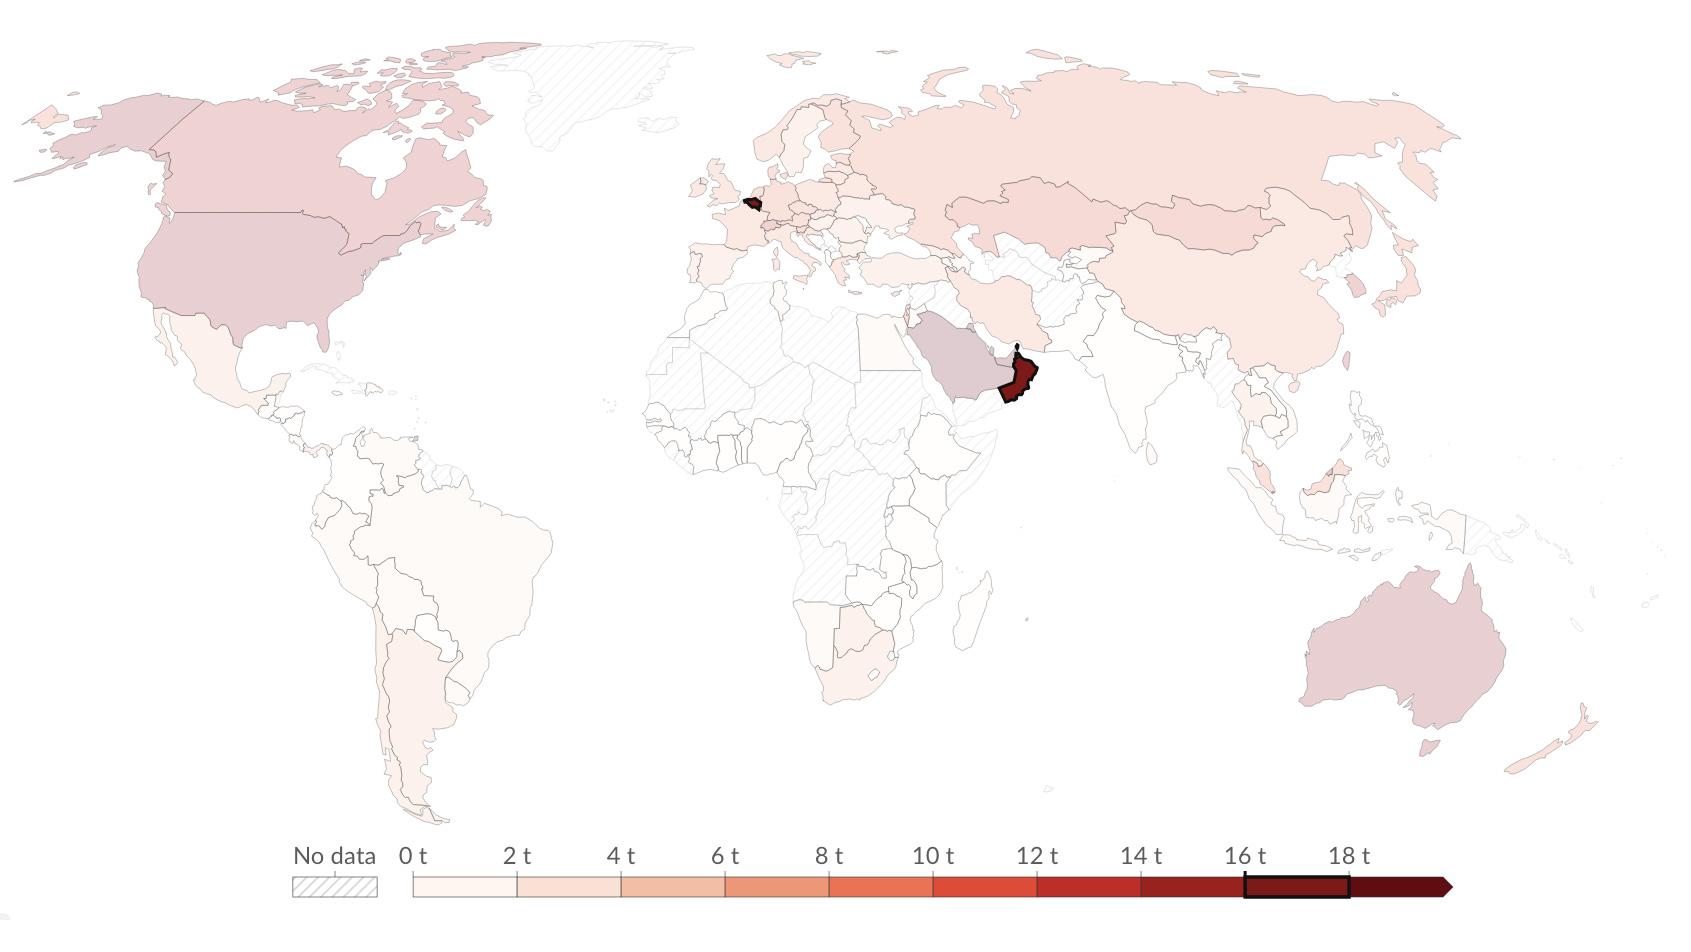
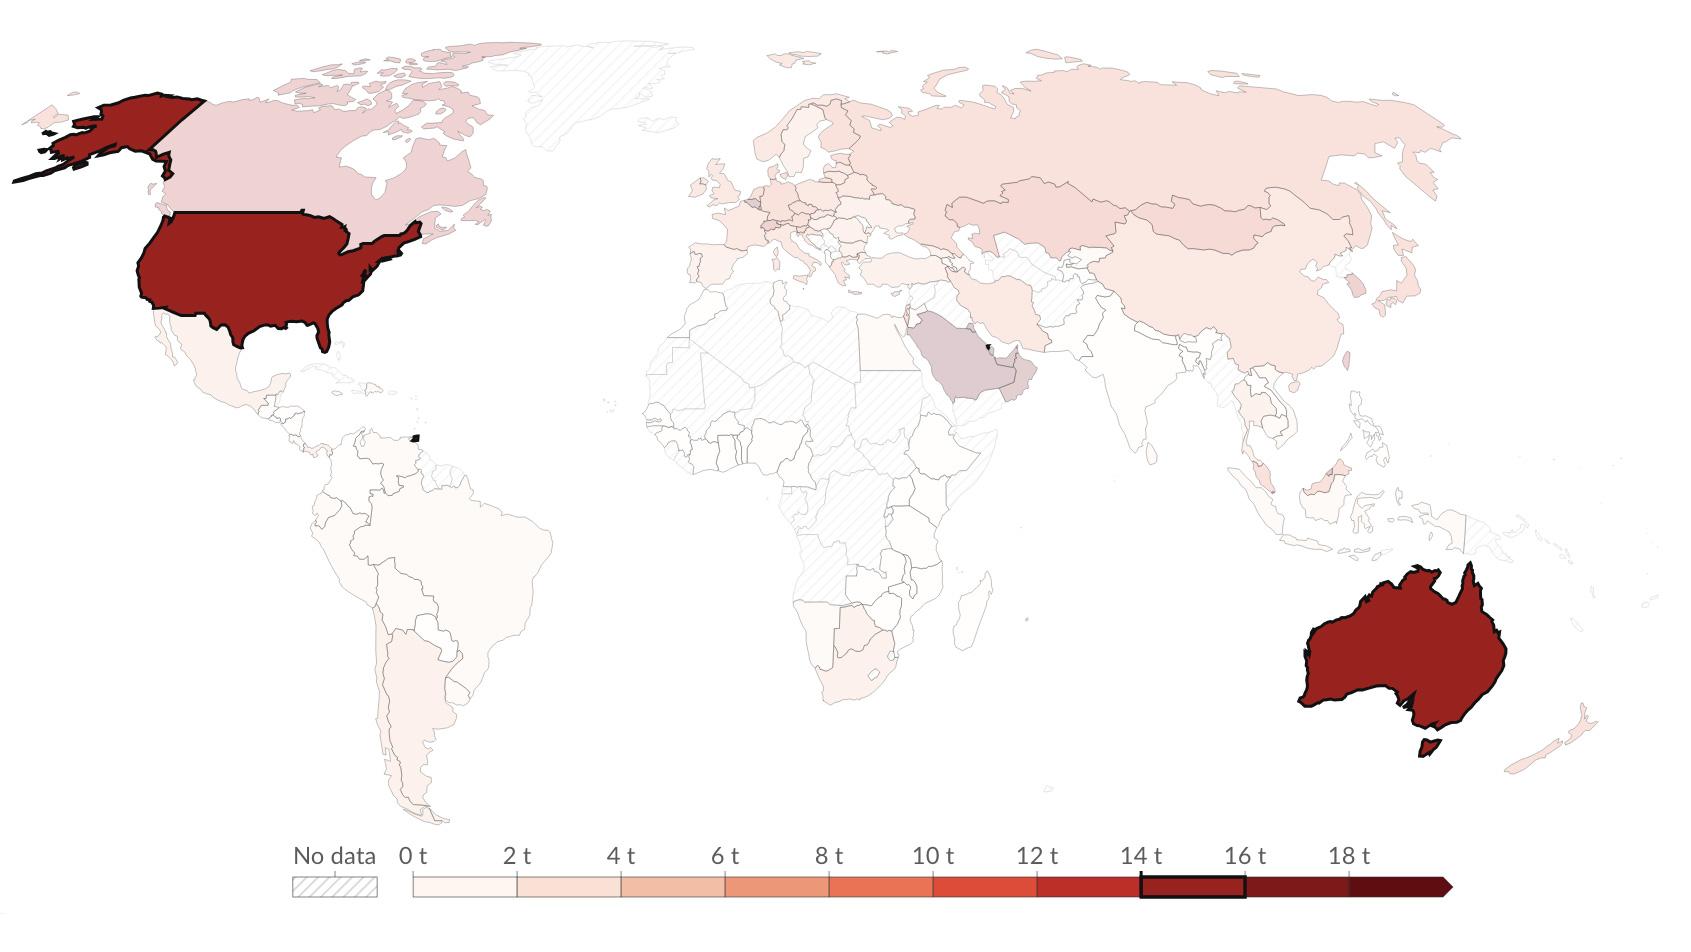
It’s graded in 10 bands, with 0 to 2 tonnes per year being the lowest, and 18 tonnes and over being the highest.
It’s quite instructive: https://ourworldindata.org/grapher/consumption-co2-per-capita
Some screenshots and notes follow