

Slide showing:
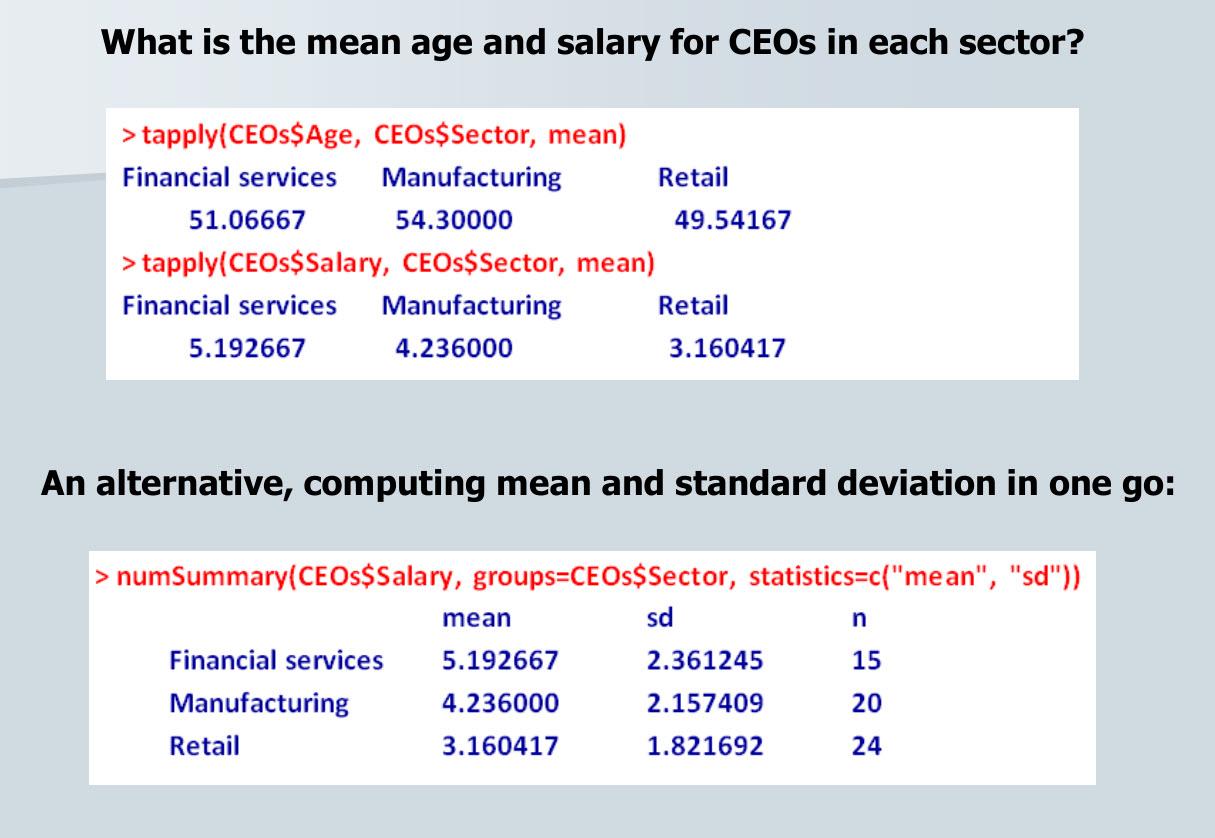
Bold header: What is the mean age and salary for CEOs in each sector?
R commands and output:
> tapply(CEOs$Age, CEOs$Sector, mean)
Financial services Manufacturing Retail
51.06667 54.30000 49.54167
> tapply(CEOs$Salary, CEOs$Sector, mean)
Financial services Manufacturing Retail
5.192667 4.236000 3.160417
Another bold header: An alternative, computing mean and standard deviation in one go:
R command and its output:
> numSummary(CEOs$Salary, groups=CEOs$Sector, statistics=c("mean", "sd"))
mean sd n
Financial services 5.192667 2.361245 15
Manufacturing 4.236000 2.157409 20
Retail 3.160417 1.821692 24
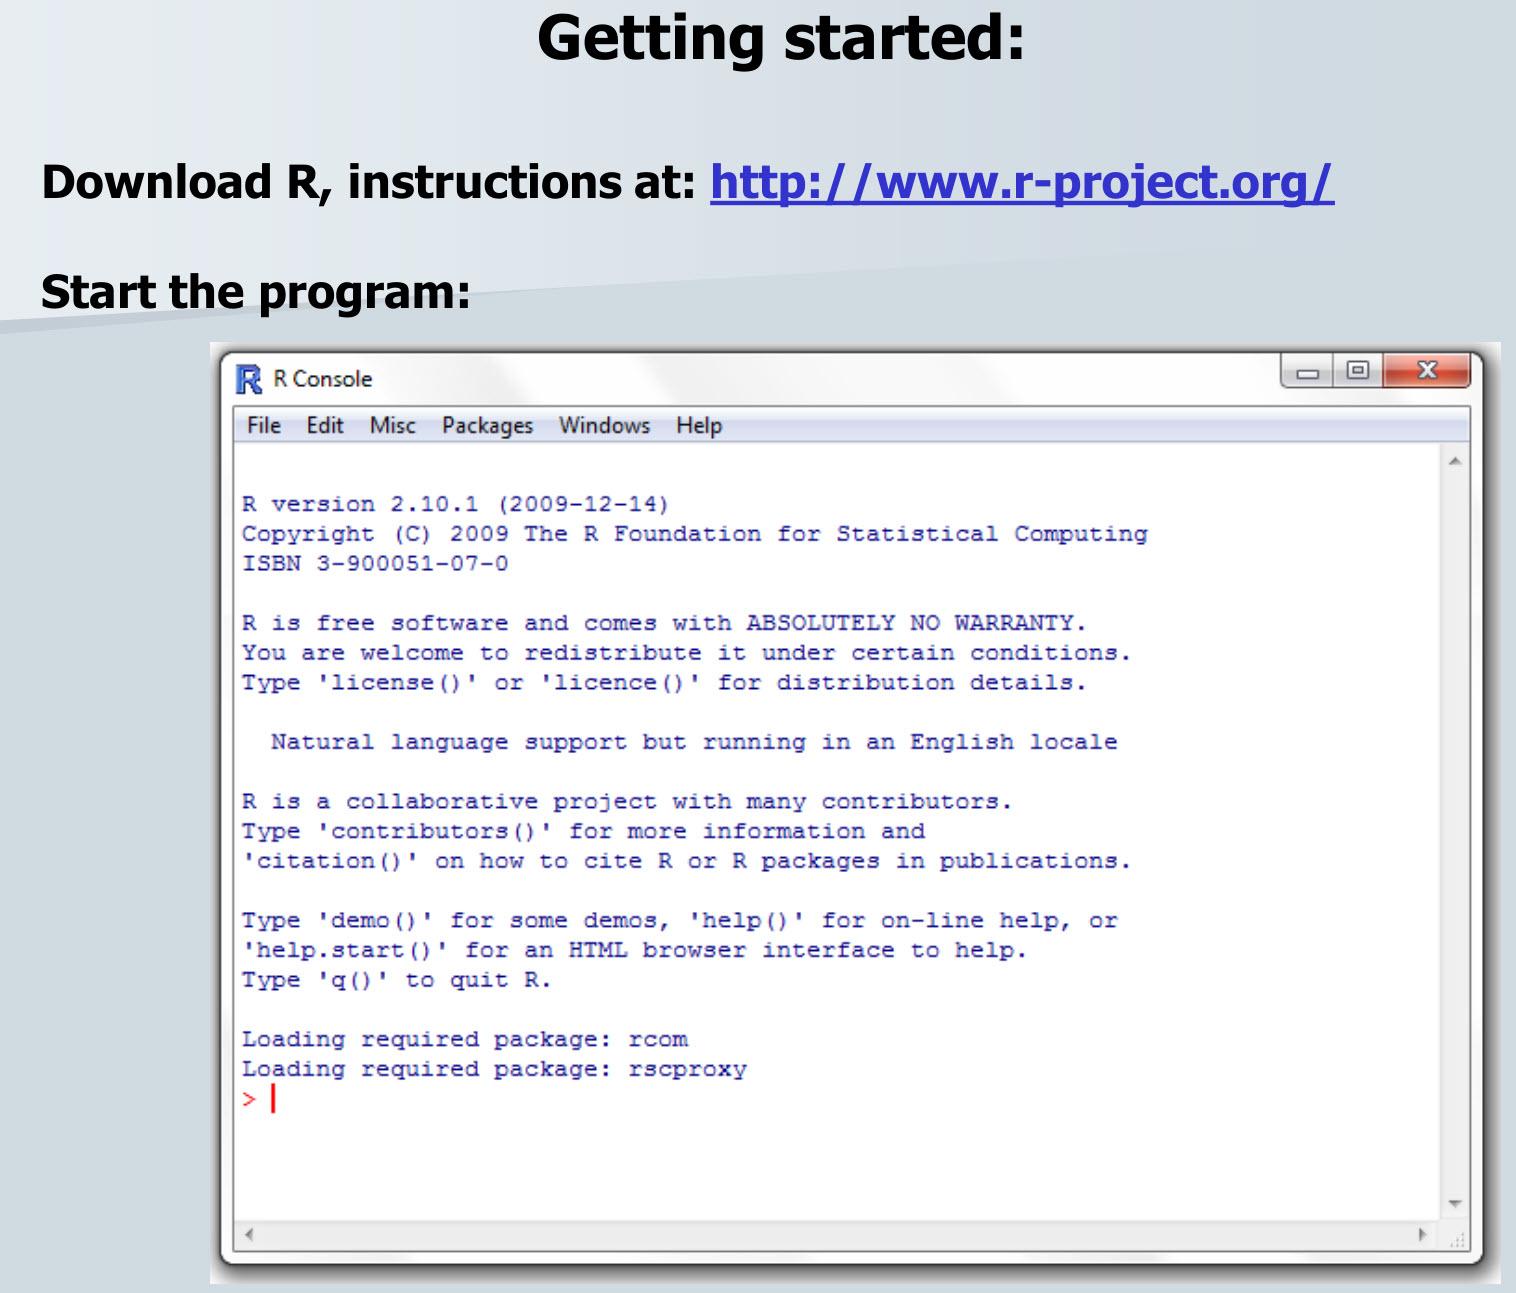
Image of a slide that says
Getting started:
Download R, instructions at: http://www.r-project.org/
Start the program:
Below that, there's a screenshot of an R Console window displaying:
R version 2.10.1 (2009-12-14)
Copyright (C) 2009 The R Foundation for Statistical Computing
ISBN 3-900051-07-0
R is free software and comes with ABSOLUTELY NO WARRANTY.
You are welcome to redistribute it under certain conditions.
Type 'license()' or 'licence()' for distribution details.
Natural language support but running in an English locale
R is a collaborative project with many contributors.
Type 'contributors()' for more information and
'citation()' on how to cite R or R packages in publications.
Type 'demo()' for some demos, 'help()' for on-line help, or
'help.start()' for an HTML browser interface to help.
Type 'q()' to quit R.
Loading required package: rcom
Loading required package: rscproxy
>