Discussion
Loading...

Post

  • About
  • Code of conduct
  • Privacy
  • Users
  • Instances
  • About Bonfire
Dan Piponi
@dpiponi@mathstodon.xyz  ·  activity timestamp 16 hours ago

I can't believe I didn't know this fact before today - it seems so fundamental.

If you have a real symmetric matrix A, and pick some unit vector x, then it's standard textbook material that x.Ax (the Rayleigh quotient) is bounded by the smallest and largest eigenvalues. So what happens if I pick a random unit vector, how is x.Ax distributed?

Let's jump to the case of a Hermitian matrix A and a random unit vector on the complex sphere. How is T=conj(x).A.x distributed? Again it's standard that it's bounded between the smallest and largest eigenvalue.

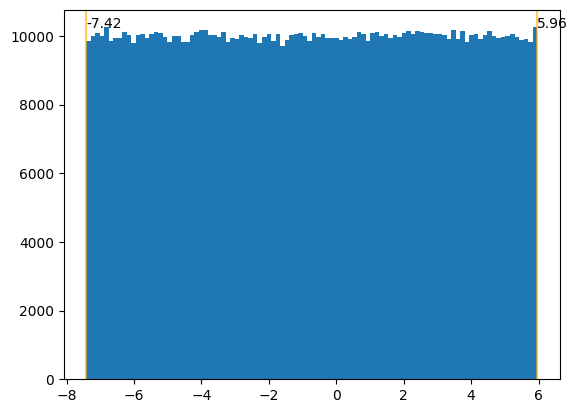
We can start with a 2x2 matrix A. First surprise to me: T is distributed *uniformly* between the two eigenvalues.

The first plot below is the histogram of values of T for 1,000,000 vectors x and a randomly chosen Hermitian matrix A. The yellow lines mark the two eigenvalues.

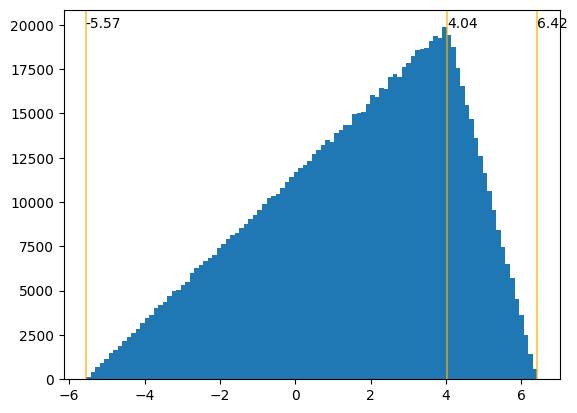
Now try 3x3. Remarkably the distribution is piecewise linear with the break points at the eigenvalues.

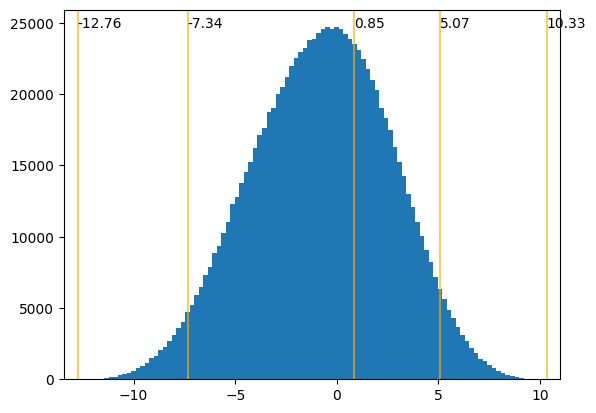
And let's jump to 5x5. We get the third plot, whose curve is given by a cubic B-spline with control points given by the eigenvalues.

Bizarrely you can prove you always get B-splines making this one of the few times I've seen B-splines in "nature", so to speak.

This is a purely mathematical result but I found it in this paper on wave transport through random media: https://arxiv.org/abs/2511.04602

My calculations (pretty much the same as the paper) are here: https://colab.research.google.com/drive/1g7ImBblYAsninp5-sr6uWQTVfTYurerE?usp=sharing

Google Colab

arXiv.org

Probability Distribution for Coherent Transport of Random Waves

We establish a comprehensive probability theory for coherent transport of random waves through arbitrary linear media. The transmissivity distribution for random coherent waves is a fundamental B-spline with knots at the transmission eigenvalues. We analyze the distribution's shape, bounds, moments, and asymptotic behaviors. In the large n limit, the distribution converges to a Gaussian whose mean and variance depend solely on those of the eigenvalues. This result resolves the apparent paradox between bimodal eigenvalue distribution and unimodal transmissivity distribution.
A slightly skewed Gaussian histogram.
A "triangular" histogram going up from zero and then back down. Not symmetric.
A histogram almost flat between its endpoints.
  • Copy link
  • Flag this post
  • Block
Log in

bonfire.cafe

A space for Bonfire maintainers and contributors to communicate

bonfire.cafe: About · Code of conduct · Privacy · Users · Instances
Bonfire social · 1.0.0 no JS en
Automatic federation enabled
  • Explore
  • About
  • Members
  • Code of Conduct
Home
Login