Discussion
Loading...

Post

  • About
  • Code of conduct
  • Privacy
  • Users
  • Instances
  • About Bonfire
Eugene :freebsd: :emacslogo:
@evgandr@mastodon.bsd.cafe  ·  activity timestamp 2 days ago

Pretty interesting how an old hardware works well and compute well in the strange configurations.

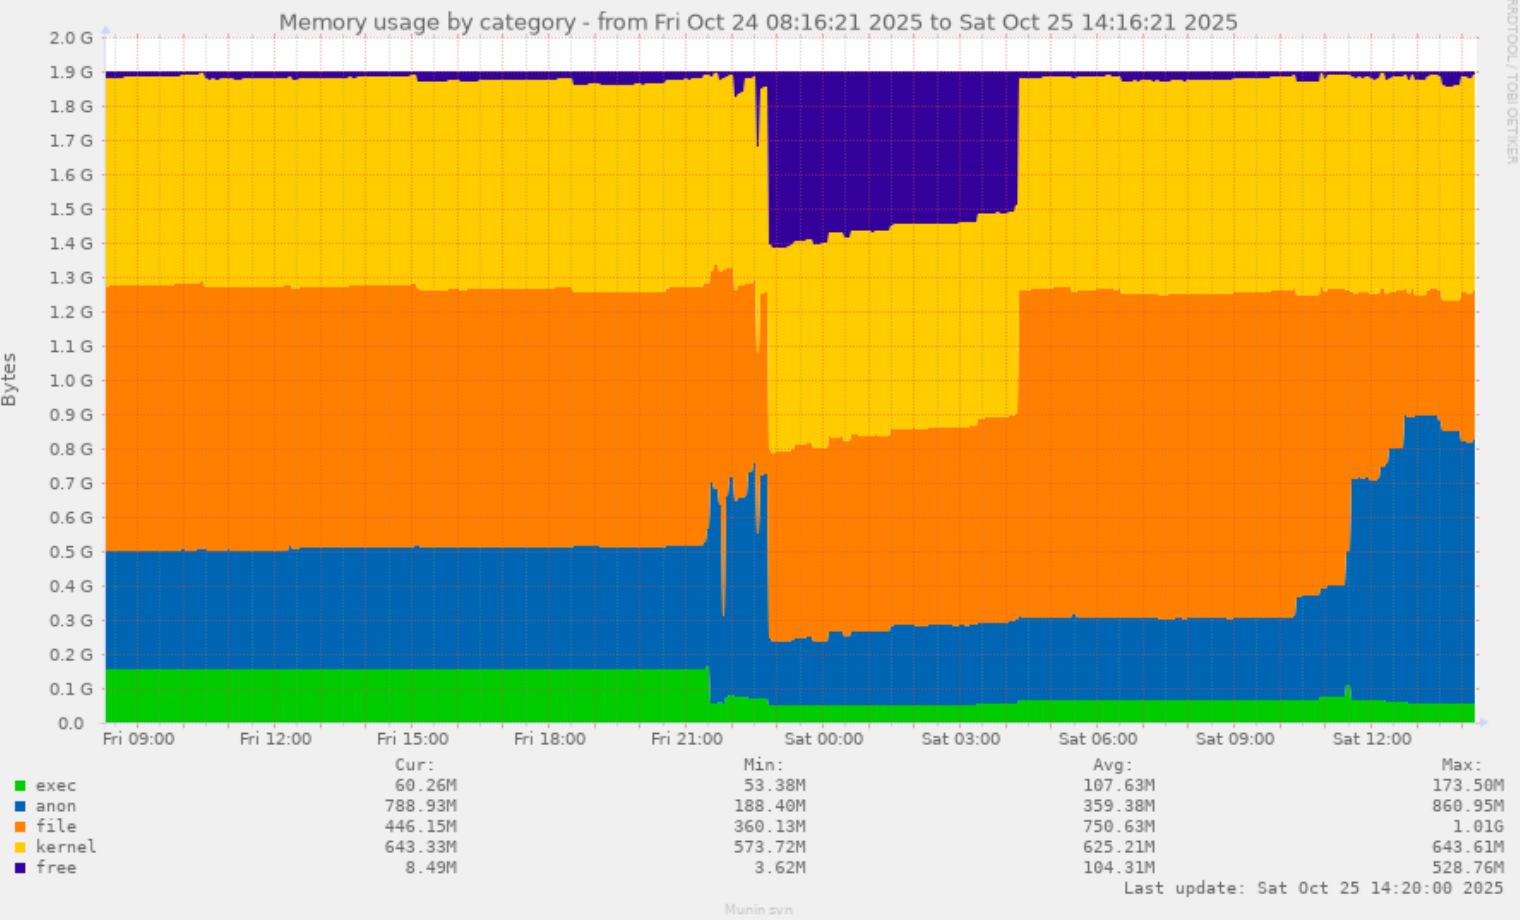
Prereqs: Intel Atom N2800 1866 MHz and 2 Gb RAM.

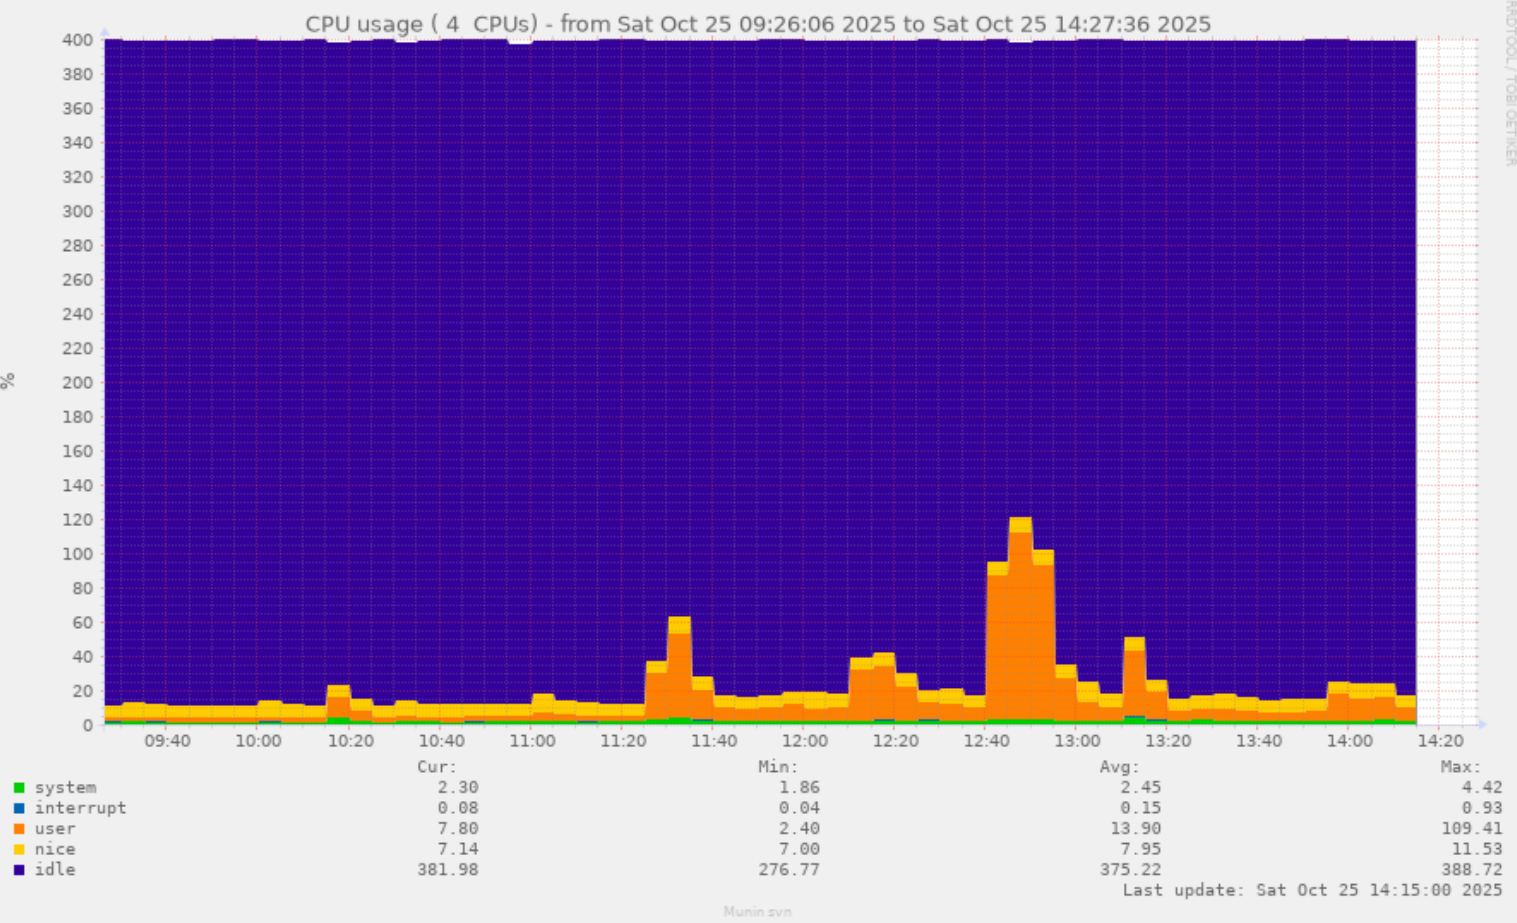
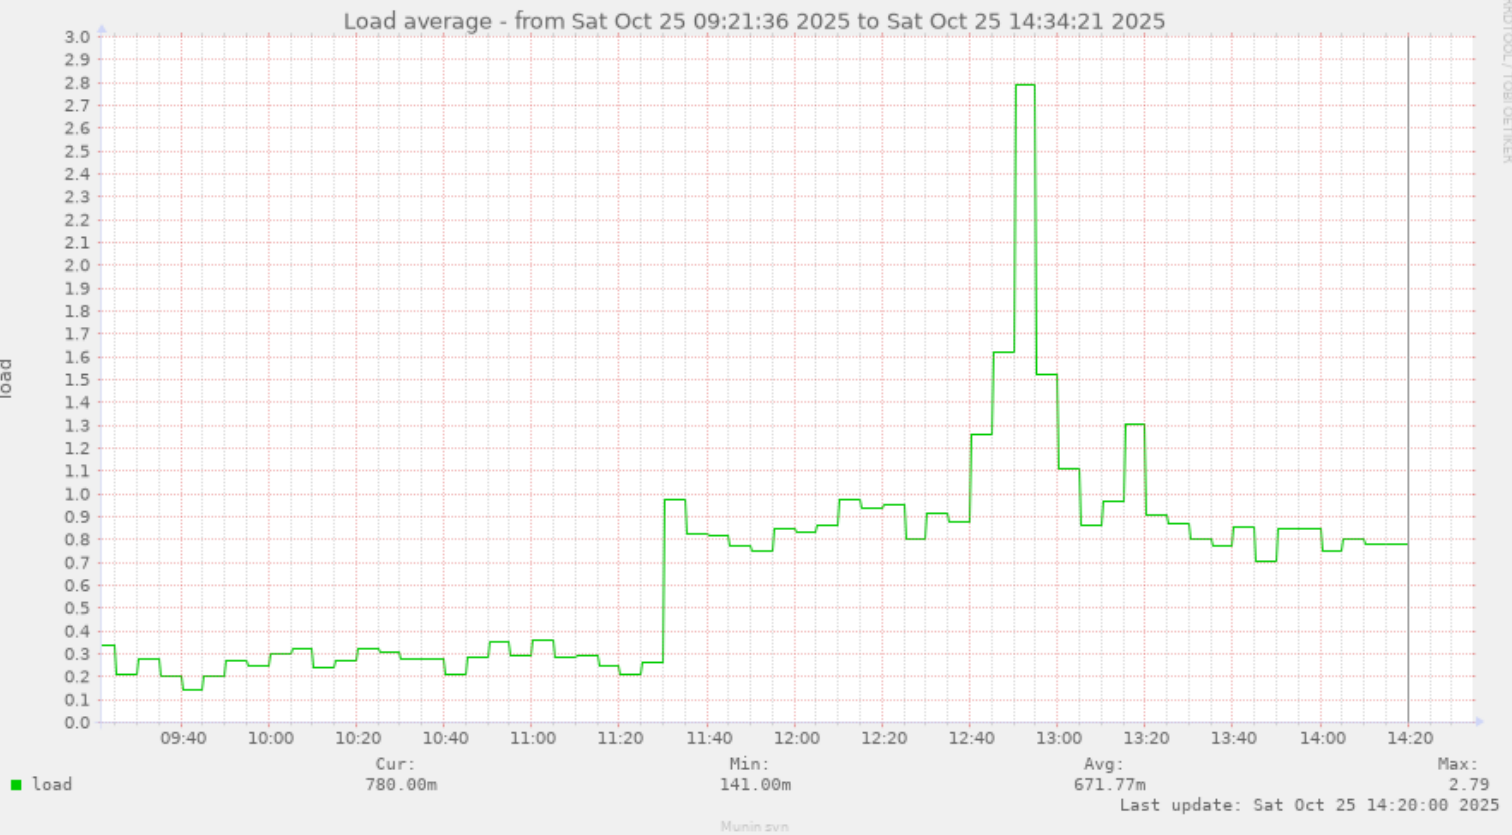
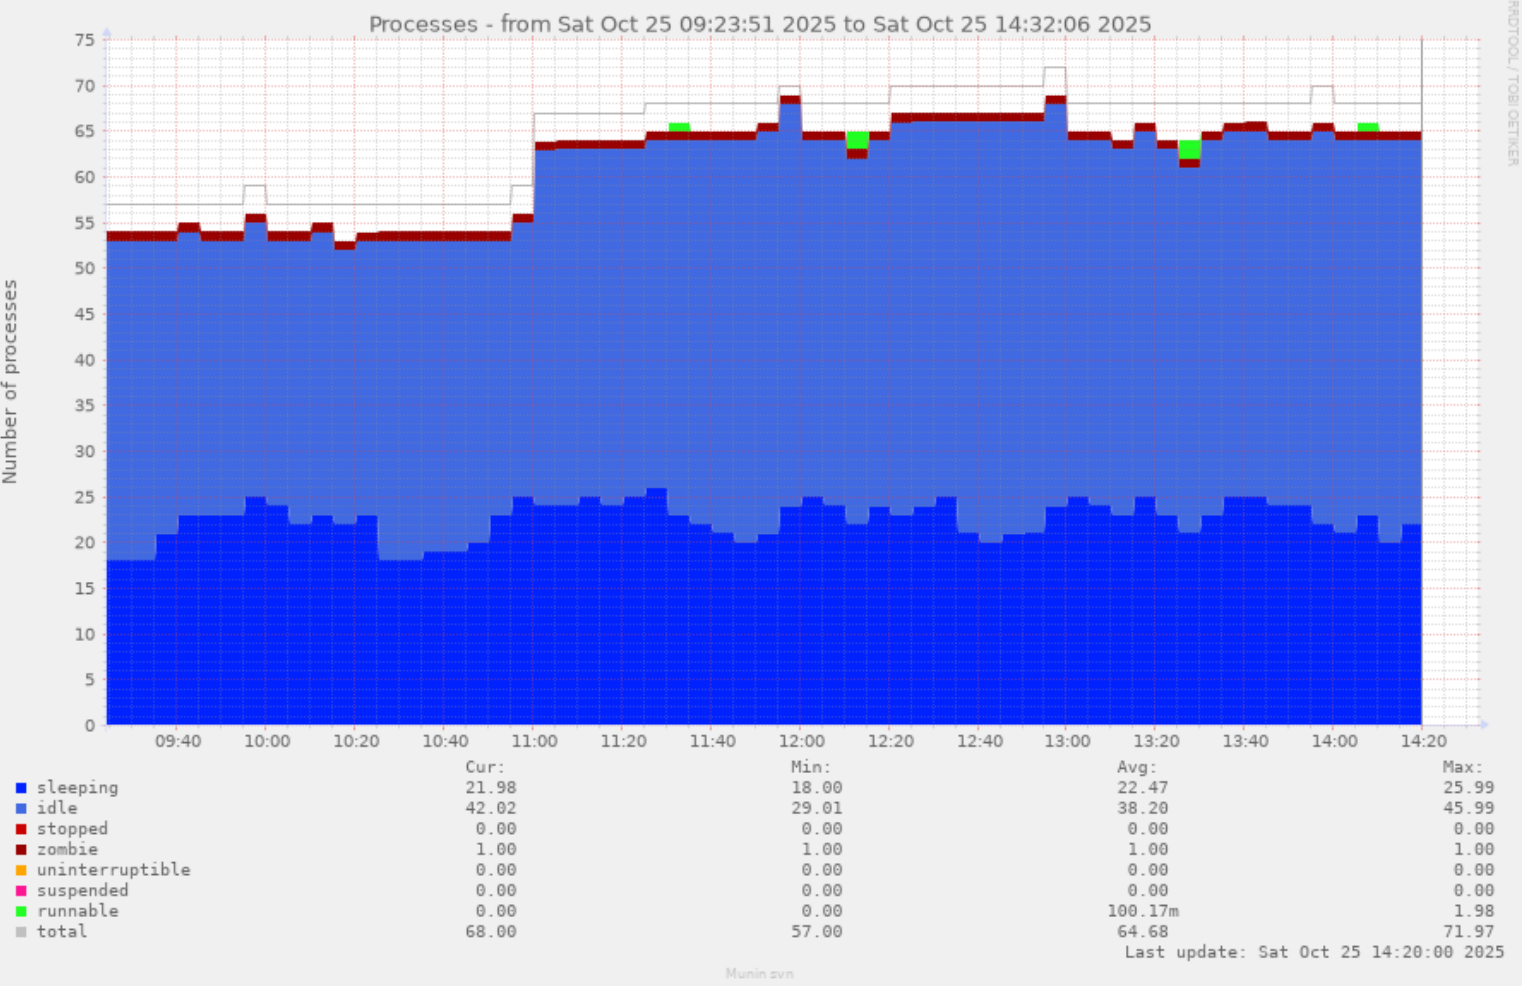
Since there are no NetBSD builds of xray-core and v2raya — I spin up a FreeBSD VM inside the Qemu and without NVMM accelerator (not supported by my CPU). Execute these programs inside this VM — and the server still running and even doesn't overload drgn_shocked

#NetBSD #FreeBSD #Qemu #IntelAtom #SelfHosting

Processes graph from Munin. It shows that there are near 53 processes before 11:00 and near 65 processes after this time.
The memory usage by category graph. It shows rise of anon memory from 0.3 Gb to 0.8 Gb at near 11:00 or 12:00.
Load average graph from Munin. Overall usage were at near 0.3 but raised to 0.8 at 11:30. With one visible spike to 2.8 at near 12:50
CPU usage graph from Munin. The graph shows 5-10% CPU usage. The graph rises to near 5% at near 11:40. With one visible spike to 120% at near 12:50.
  • Copy link
  • Flag this post
  • Block
Log in

bonfire.cafe

A space for Bonfire maintainers and contributors to communicate

bonfire.cafe: About · Code of conduct · Privacy · Users · Instances
Bonfire social · 1.0.0-rc.3.21 no JS en
Automatic federation enabled
  • Explore
  • About
  • Members
  • Code of Conduct
Home
Login